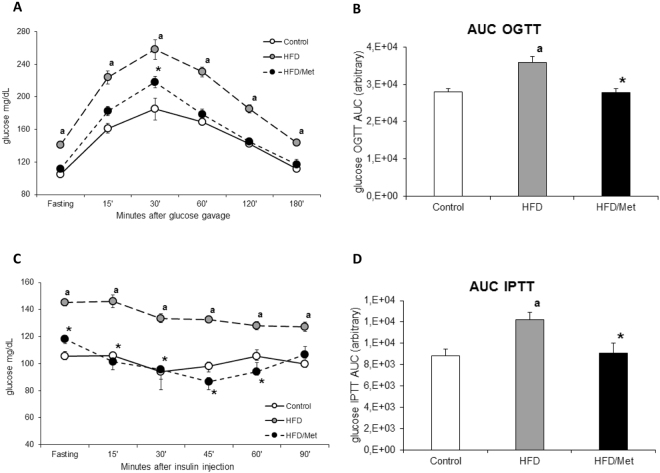
Figure 1.
Treatment with metformin improves glucose and insulin tolerance in animals on high-fat diet. Panel A shows blood glucose profiles during oral glucose tolerance test (OGTT); Panel C shows blood glucose profiles during intraperitoneal insulin tolerance test (IPTT). Panels B and D show respective areas under blood glucose concentration curve (AUC) from OGTT and IPTT tests. Values are mean +/− SD. Symbols denote statistical significance of p < 0.05 against: a- vs. Control group; *- vs. HFD group, n = 8 per group; Significance by Anova with Tukey HSD post-hoc test.

