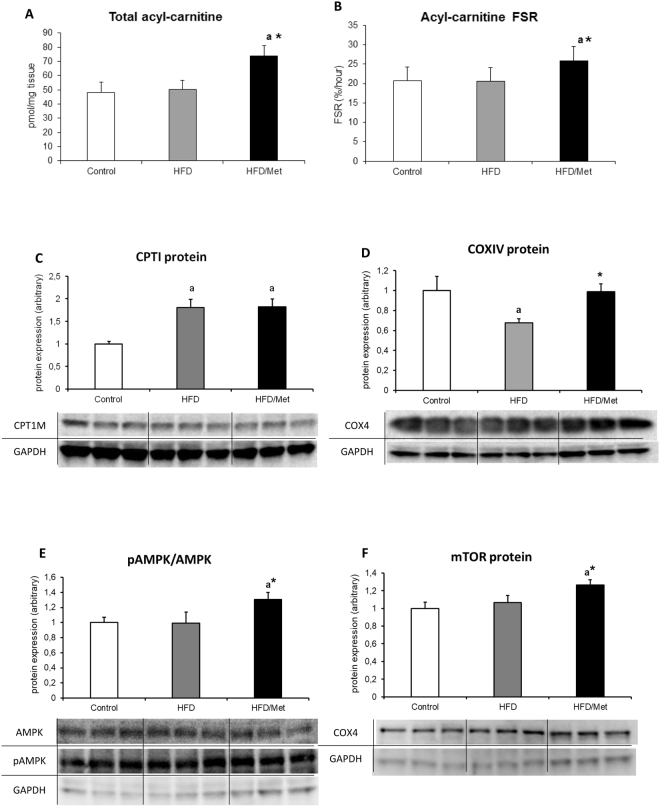
Figure 4.
The impact of HFD consumption and metformin treatment on mitochondrial channeling of fatty acids and AMPK/mTOR proteins. Panel A and B present total content and synthesis rate of hepatic acyl-carnitine, respectively; Panel C and D show liver expression of carnitine palmitoyltransferase 1 (CPTI) and cytochrome c oxidase subunit IV (COX IV, mitochondrial marker); Panels E and F present phosphorylation state of AMPK and the protein expression of mTOR. Values are mean +/− SD. Symbols denote statistical significance of p < 0.05 versus: a- vs. Control group; *- vs. HFD group. n = 8 per group; Significance by Anova with Tukey HSD post-hoc test.

