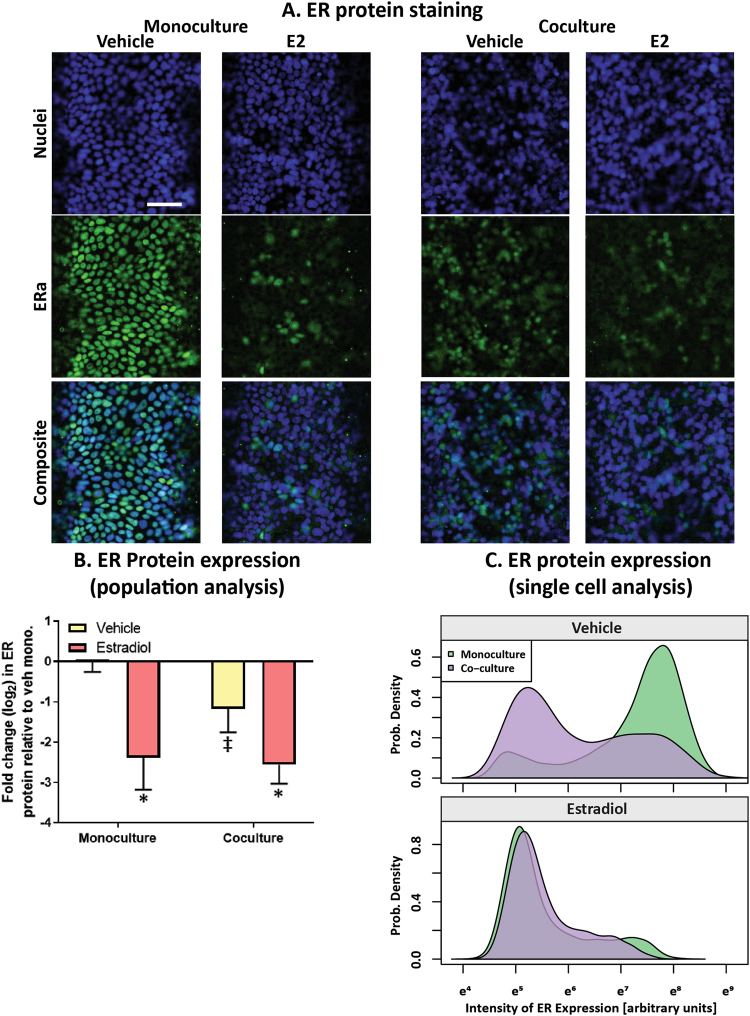
Figure 3.
MCF7-derived ducts grown in a mixed collagen:fibroblast matrix express lower levels of ER protein. MCF7-derived ducts were cultured alone or in co-culture with HMFs, treated with a vehicle control or 100 nM E2 for 24 hours. (A) Cultures were fixed and stained to visualize nuclei and ERα protein. Scale bar represents 100 μm. To quantify ER protein, the Hoescht stain was used to generate nuclear masks then ER expression was quantified within each nuclear mask. (B) Mean ER expression per condition was graphed to visualize ER protein changes within the entire population. A two-way ANOVA was run to evaluate interactions between conditions, followed by a Tukey’s multiple comparison test to identify significant differences. (C) A density plot was created to show the frequency of individual cells (x-axis) that expressed various levels of ER protein (y-axis). *= vs. respective vehicle (p < 0.05) and ‡= vs. respective monoculture (p < 0.05). Data is representative of three independent experiments.

