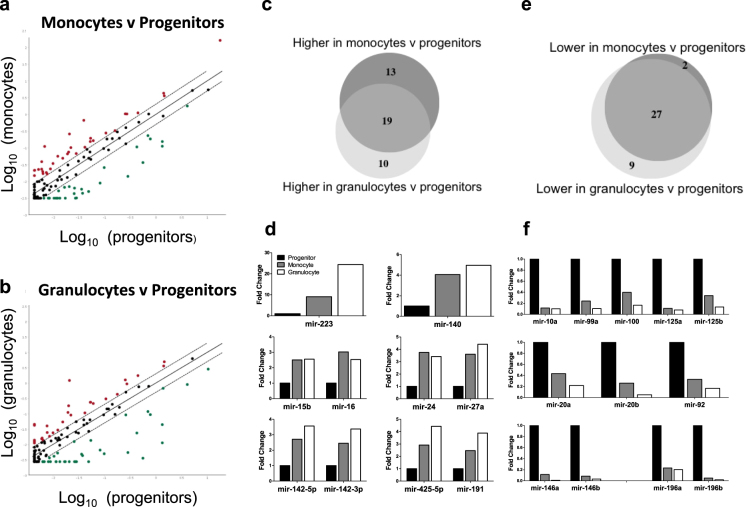
Figure 2.
MiRNA profiling of cord blood myeloid progenitors, monocytes and neutrophils. Normalised TaqMan Low-Density Array (TLDA) profiles of miRNA expression in (a) monocytes vs. myeloid progenitors and (b) granulocytes vs. myeloid progenitors from human cord blood. MiRNAs with ≥ 2-fold increased expression in the mature cell types are shown in red and those with ≥ 2-fold decreased expression are shown in green. (c) Number of miRNAs increased ≥ 2-fold or more in each comparison. (d) Top panel: miRNAs with a ≥ 2-fold increase in both cell types. Middle and lower panel: miRNAs that are increased in both cell types and are clustered together in the genome. (e) Number of miRNAs decreased ≥ 2-fold in each comparison. (f) Top panel: the five miRNAs of the same family (highly similar seeds) that are decreased in both mature cell types relative to the progenitor. Middle and lower panels: miRNAs that decreased in both comparisons and are clustered together in the genome.

