Fig. 1.
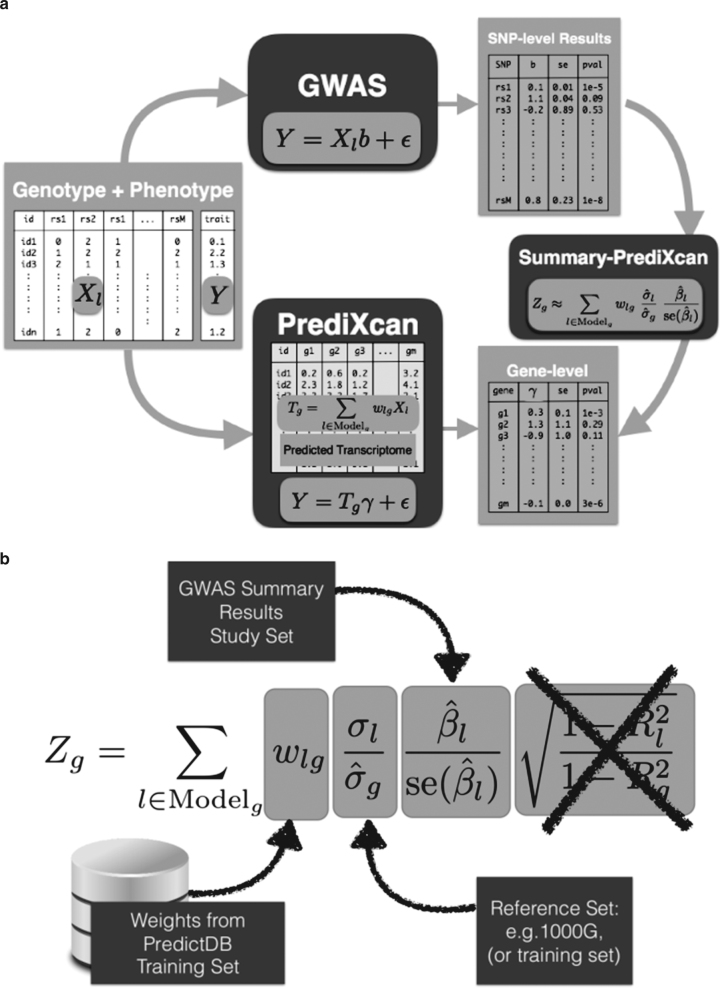
Comparison between GWAS, PrediXcan, and S-PrediXcan. a Compares GWAS, PrediXcan, and Summary-PrediXcan. Both GWAS and PrediXcan take genotype and phenotype data as input. GWAS computes the regression coefficients of Y on Xl using the model , where Y is the phenotype and Xl the individual SNP dosage. The output is a table of SNP-level results. PrediXcan, in contrast, starts first by predicting/imputing the transcriptome. Then it calculates the regression coefficients of the phenotype Y on each gene’s predicted expression . The output is a table of gene-level results. Summary-PrediXcan directly computes the gene-level association results using the output from GWAS. b Shows the components of the formula to calculate PrediXcan gene-level association results using summary statistics. The different sets involved as input data are shown. The regression coefficient between the phenotype and the genotype is obtained from the study set. The training set is the reference transcriptome dataset where the prediction models of gene expression levels are trained. The reference set (1000G, or training set having some advantages) is used to compute the variances and covariances (LD structure) of the markers used in the predicted expression levels. Both the reference set and training set values are precomputed and provided to the user so that only the study set results need to be provided to the software. The crossed out term was set to 1 as an approximation. We found this approximation to have negligible impact on the results

