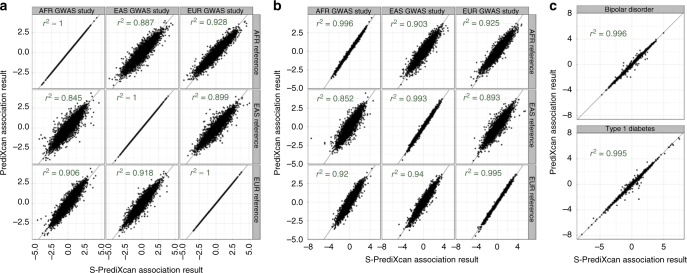
Fig. 2.
Comparison of PrediXcan and S-PrediXcan results in real and simulated traits. This figure shows a comparison of PrediXcan vs. S-PrediXcan for a a simulated phenotype under null hypothesis of no genetic component; b a cellular phenotype (=intrinsic growth); and c bipolar disorder and type 1 diabetes studies from Wellcome Trust Case Control Consortium (WTCCC). Gene expression prediction models were based on the DGN cohort presented in ref. 11. For the simulated phenotype, study sets (GWAS set) and reference sets (LD calculation set) consisted of African (661), East Asian (504), and European (503) individuals from the 1000 Genomes Project. When the same study set is used as reference set, we obtained a high correlation (coefficient of determination): r2 > 0.99999. For the intrinsic growth phenotype, study sets were a subset of 140 individuals from each of the African, Asian, and European groups from 1000 Genomes Project. The reference set was the same as for the simulated phenotype. For the disease phenotypes, the study set consisted of British individuals, and the LD calculation set was the European population subset of the 1000 Genomes Project

