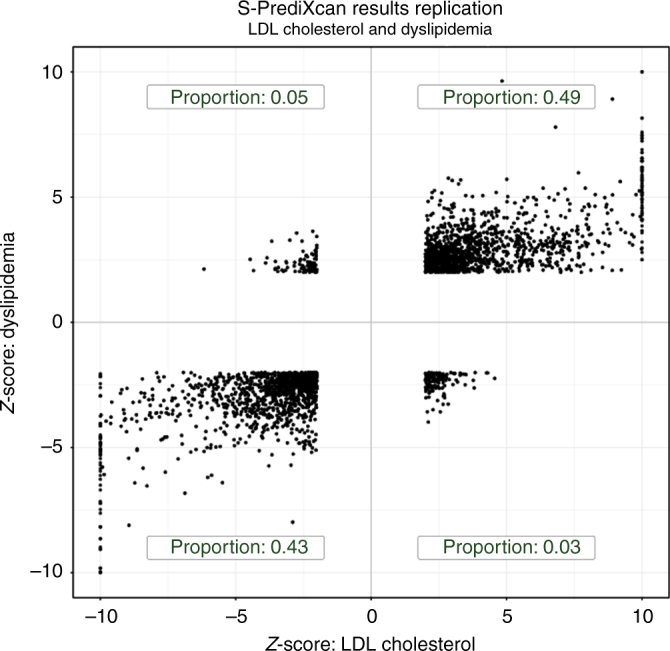
Fig. 9.

Discovery and replication Z-scores for lipid trait. This figure shows the Z-scores of the association between dyslipidemia (GERA) and predicted gene expression levels on the vertical axis and the Z-scores for LDL cholesterol on the horizontal axis. To facilitate visualization, very large Z-scores where thresholded to 10. Proportions in each quadrant were computed excluding Z-scores with magnitude smaller than 2 to filter out noise
