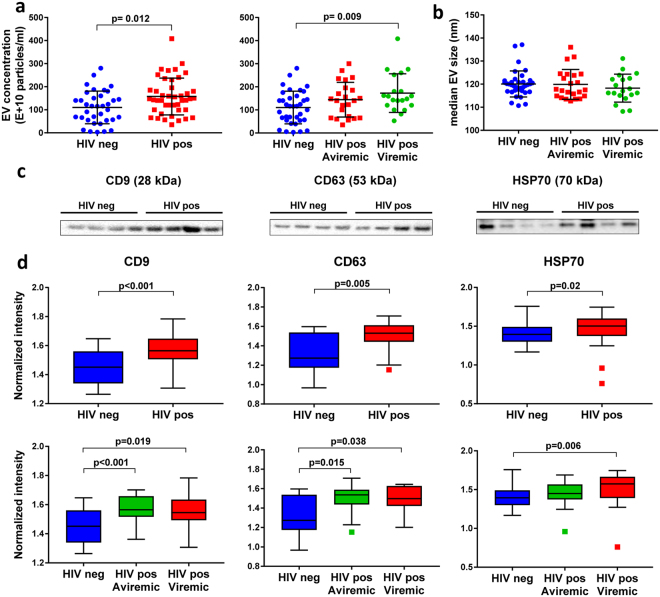
Figure 2.
Plasma exosomes and exosome markers CD9, CD63, and HSP70 are elevated in viremic HIV-positive subjects on ART compared to controls. Exosome fractions were isolated from plasma (0.4 ml) of HIV-positive subjects (aviremic and viremic with viral load <400 and 400–2500 HIV RNA copies/ml, respectively) and HIV-negative controls. Beeswarm plots show EV concentration (a) and median size (b) measured by NTA in aviremic (n = 23) and viremic (n = 20) HIV-positive versus HIV-negative subjects (n = 34). Horizontal bars represent means and error bars represent SD. (c) Proteins (25 μg protein per lane) were separated by SDS-PAGE and immunoblotted with exosome marker antibodies against CD9, CD63, and HSP70. Representative blots from 4 HIV-negative and 4 HIV-positive samples are shown. Bands in each lane were normalized to corresponding EV numbers (full length blots for all samples are shown in Supplementary Figure S3). (d) Box plots in upper panel show exosome marker protein levels in HIV-positive (n = 37) versus HIV-negative subjects (n = 27). Box plots in lower panel show exosome marker protein levels in aviremic (n = 21) and viremic (n = 16) HIV-positive versus HIV-negative subjects (n = 27). Medians are represented by horizontal bars, boxes span the interquartile range (IQR), and whiskers extend to extreme data points within 1.5 times IQR. Outliers are plotted outside 1.5 times the IQR. p-values were calculated by Mann-Whitney U test.

