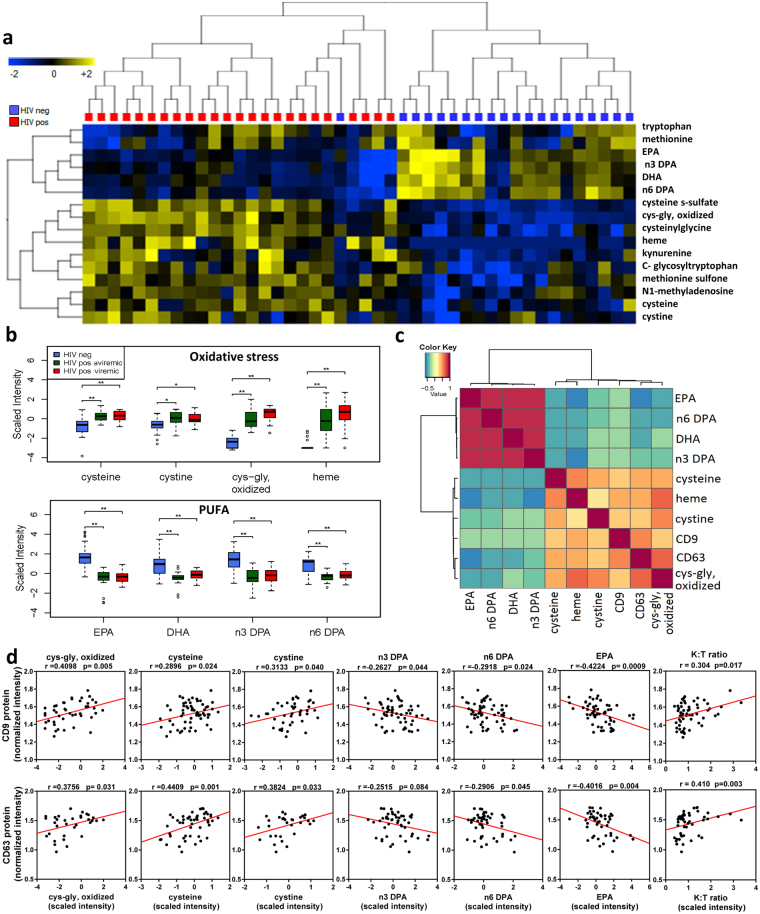
Figure 3.
Exosome markers correlate positively with oxidative stress-related metabolites and negatively with levels of n-3 and n-6 polyunsaturated fatty acids. (a) Heatmap shows unsupervised hierarchical clustering of metabolites (n = 16) associated with oxidative stress, tryptophan catabolism, and polyunsaturated fatty acid (PUFA) metabolism that distinguish HIV-positive from HIV-negative control subjects (FC > 1.3, p < 0.05, FDR < 0.10). (b) Metabolites associated with oxidative stress are increased, and the indicated PUFA are decreased in aviremic and viremic HIV-positive subjects versus controls (*p < 0.01, **p < 0.001). Medians represented by horizontal bars, boxes span the IQR, and whiskers extend to extreme data points within 1.5 times IQR. Outliers are plotted outside 1.5 times the IQR. P-values calculated by Welch’s t-test (p < 0.05; n = 26 HIV-negative, n = 21 HIV-positive aviremic, n = 16 HIV-positive viremic subjects). (c) Pearson correlation matrix r-values show positive correlation of exosome marker proteins (CD9 and CD63) with metabolites associated with oxidative stress, and negative correlation with n-3 and n-6 PUFA (p < 0.05). (d) Correlation scatter plots are shown with correlation coefficients and p-values above each plot. n = 36 HIV-positive, 26 HIV-negative. EPA, eicosapentaenoate (20:5n3); DHA, docosahexaenoate (22:6n3); n3 DPA, docosapentaenoate (22:5n3); n6 DPA, docosapentaenoate (22:5n6); K:T ratio, kynurenine: tryptophan ratio. Scatter plots showing Pearson correlation plots for additional exosome markers and metabolites are in Supplementary Figure S4.

