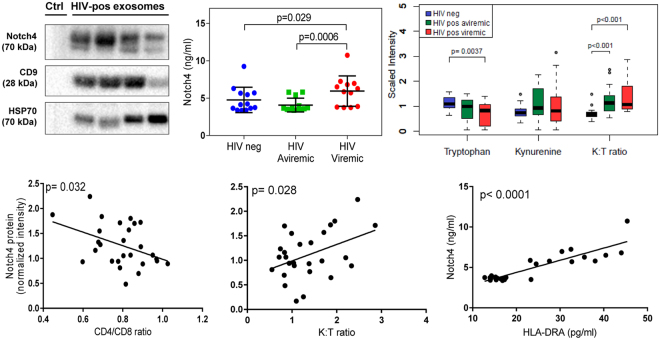
Figure 4.
Notch4 protein is detected in plasma exosome fractions from HIV-positive subjects on ART and correlates with immune activation markers. Plasma exosome fraction (25 μg protein per lane, Ctrl = PBS blank) immunoblotted with Notch4 and exosome marker antibodies (top left). Blots are cropped and full-length blots are included in Supplementary Figure S6. Notch4 protein measured by ELISA in exosome fractions from aviremic and viremic HIV-positive versus HIV-negative subjects (top middle). Horizontal bars represent mean, error bars represent SD. P-values calculated by Mann-Whitney U test. Plasma K:T ratio is increased in aviremic and viremic HIV-positive subjects versus controls (top right). Medians in boxplots are represented by horizontal bars, boxes span the interquartile range (IQR), and whiskers extend to extreme data points within 1.5 times IQR. Outliers are plotted outside 1.5 times IQR. P-values calculated by Welch’s t-test (n = 21 HIV-negative, n = 18 aviremic, and n = 13 viremic HIV-positive subjects). Notch4 levels in HIV-positive plasma exosome fractions correlate negatively with increasing CD4/CD8 ratio and positively with K:T ratio and exosome-HLA-DRA levels in Pearson correlations (bottom panels, p < 0.05; n = 25–27).

