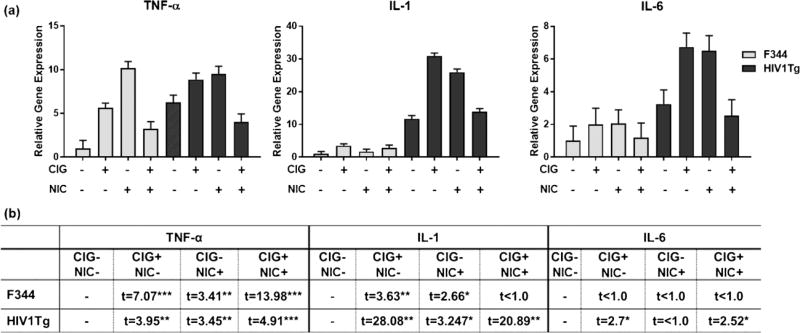
Figure 2.
F344 and HIV1Tg rat exposure group versus control group frontal cortex proinflammatory cytokine gene expression. a Plots of TNF-α, IL-1, and IL-6 gene expression levels, analyzed by RT-PCR (N = 3 rats pergroup). b Comparison of cytokine gene expression levels. CIG = cigarettes; NIC = nicotine; *p < 0.05; **p < 0.01; ***p < 0.001 (adjusted for multiple comparisons using the Bonferroni correction).

