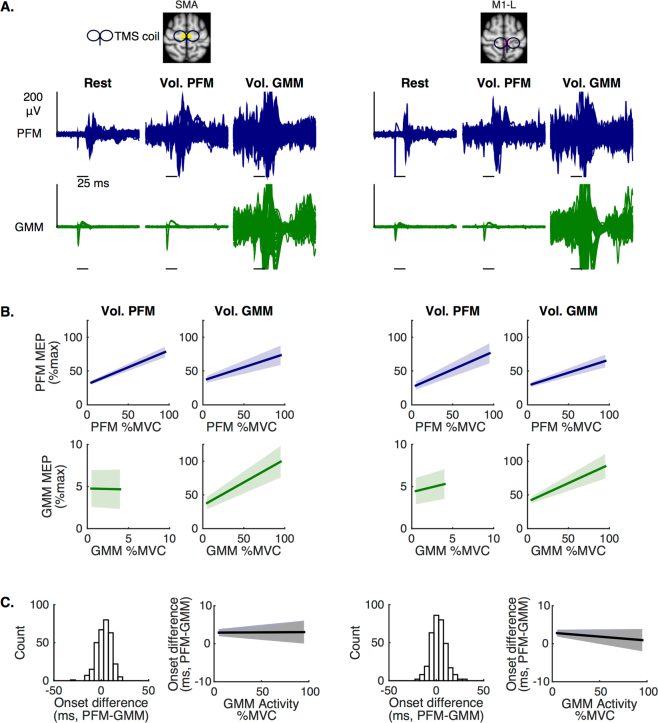
Figure 4.
Transcranial magnetic stimulation (TMS) evidence of increasing neural activation in human supplementary motor area (SMA) and primary motor cortex (M1) during increased voluntary drive. (A) Pelvic floor muscles (PFM) hotspots in SMA and M1-L were separately stimulated to test whether MEPs can be elicited in the PFM (top row) and the gluteus maximus muscle (GMM, bottom row) at rest (first column), during PFM voluntary activation (second column), and during GMM voluntary activation (third column). Plotted MEPs were limited to contraction levels ≤ 25% MVC. PFM MEPs were observed at rest and during PFM and GMM voluntary activations. However, no GMM MEPs were observed at rest or during PFM voluntary activation. GMM MEPs were only observed during GMM voluntary activation. (B) Population average (solid line, ± SEM) MEPs peak-to-peak values (amplitudes) from a linear mixed model with participant-level random intercepts and slopes. In both motor regions, increased PFM activation resulted in significantly increased amplitudes of PFM MEPs (PFM-SMA: p = 0.0001, PFM-M1-L: p = 0.0017). However, increasing PFM activation did not result in increasing either GMM activation level or GMM MEPs amplitudes. In both motor regions, increasing GMM activation resulted in modulating PFM activation level, as well as, in modulating amplitudes of PFM and GMM MEPs (PFM-SMA: p = 0.0076, PFM-M1-L: p = 0.0011, GMM-SMA: p = 0.0052, GMM-M1-L: p = 0.009). (C) Distribution of the difference between onset latency of PFM MEPs and onset latency of corresponding GMM MEPs during GMM voluntary activation. Using linear mixed model with participant-level random intercepts and slopes showed that increasing GMM activation was not associated with changes in the difference (latency of PFM MEPs - latency of GMM MEPs, SMA: p = 0.9539, M1-L: p = 0.3954) that remained about +3 ms on average and was significantly greater than zero (SMA: p = 0.0121, M1-L: p = 0.0114).

