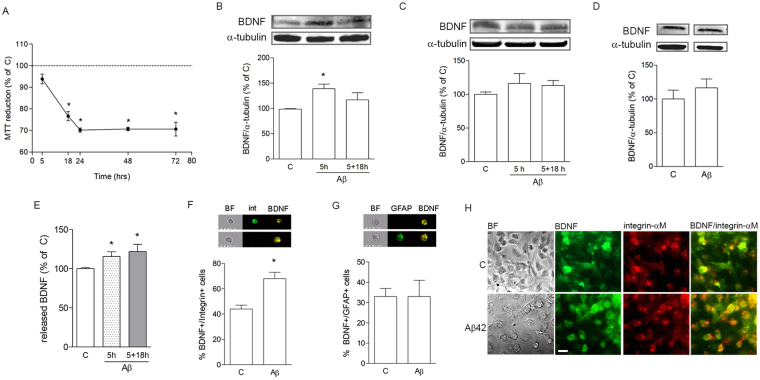
Figure 2.
Aβ42 selectively induces microglial mature BDNF expression and release. MTT analysis of Aβ42 (0.5 μM) toxicity on differentiated SH-SY5Y cells treated for different time points, as indicated (A). Western blot analysis of BDNF expression in pMG (B) or pAS (C) treated with Aβ42 (0.5 μM) for 5 h or pulsed for 5 h followed by medium change and further incubation without Aβ for 18 h (labeled as 5 + 18 h). Western blot analysis of BDNF expression in SH-SY5Y cells exposed to Aβ42 (0.5 μM) for 5 h (D). ELISA determination of released BDNF in medium collected from pMG treated for 5 h or 5 + 18 h (E). Image cytofluorometric analysis of co-localization of BDNF with integrin α-M (int; F) or GFAP (G) in mxG cells. BF = brightfield. Double immunostaining of BDNF (green) and integrin α-M (red) in control vs Aβ42-treated (0.5 μM for 5 h) pMG (H). Scale bar is 20 μm. Blots were cropped to display specific bands. Original blots are reported in Supplementary Fig. 1. Values are mean ± SEM with n = 3-5. *p < 0.05 vs. untreated control by one-way ANOVA followed by Newman-Keuls test for significance or Student’s t-test, as appropriate.

