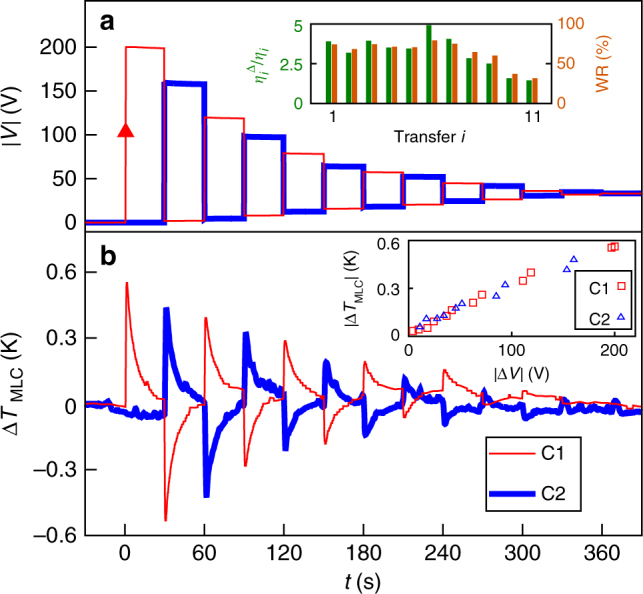
Fig. 4.

Demonstration of energy recovery. a Voltage magnitude |V| across C1 (thin red line) and C2 (thick blue line) after charging C1 at time t = 0 (red arrow) and then transferring charge between C1 and C2 every 30 s (transfer i took place at t = 30i s). Inset: and WR = 1 − , where work denotes the work done in transfer i by the MLC that discharges. b The corresponding changes of EC temperature ΔTMLC for C1 (thin red line) and C2 (thick blue line). Inset: for C1 and C2, we plot the sharp jumps of |ΔTMLC| in b vs. the corresponding jumps of |ΔV| in a
