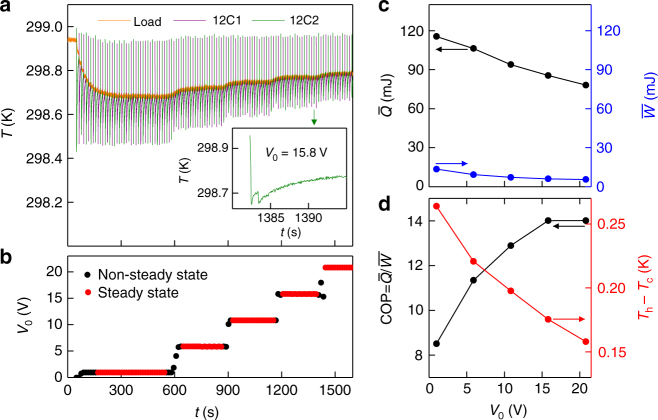
Fig. 6.
EC prototype with modified energy recovery. a Data shown in the first ~600 s are similar to the data of Fig. 5d. On subsequently setting (b) finite values of V0, each plate (whose temperature is given by the green or purple data) underwent adiabatic EC cooling in two separate steps, after each of which it slowly absorbed heat from the load, whose temperature Tc (orange data) was thus reduced with respect to starting temperature Th. The inset shows a detail of the two-step process for 12C2. For steady-state operation at different values of V0 (red in b), we present (c) average values of heat and work , and hence (d) values of COP = for each temperature span Th − Tc identified via a. Note that V0 = 0 prior to initial steady-state operation with V0 = 0.9 V

