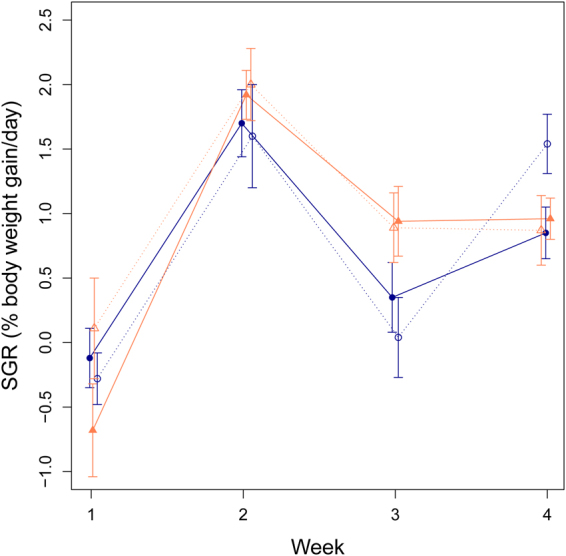
Figure 3.

Specific growth rate (SGR) (% body weight gained/ day) over four time intervals, from tagging until the first CTmax test (Week 1) and then weekly thereafter (Weeks 2–4). Solid lines and filled symbols represent the repeatability group (which underwent weekly CTmax tests) and dashed lines and open symbols represent the sham group (which only had one CTmax test in Week 4 and experienced sham CTmax tests in Weeks 1–3). Females are represented by orange triangles and males by blue circles. Values are given as means ± s.e.m.
