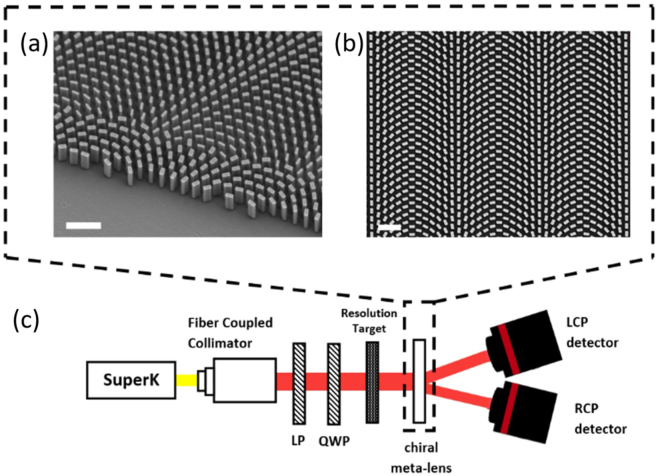
Figure 2.
Device and measurement setup. (a) Top-side view of the SEM micrograph picture at the edge of the metasurface lens. Scale bar: 1 (b) Top-view SEM micrograph picture close to the center of the chiral meta-lens. Scale bar: 1 (c) The 1951 USAF resolution test chart illuminated with a supercontinuum laser. The polarization is controlled with a linear polarizer LP and a quarter-wave plate QWP. The sample focuses the LCP and RCP image of the resolution test chart on detector.

