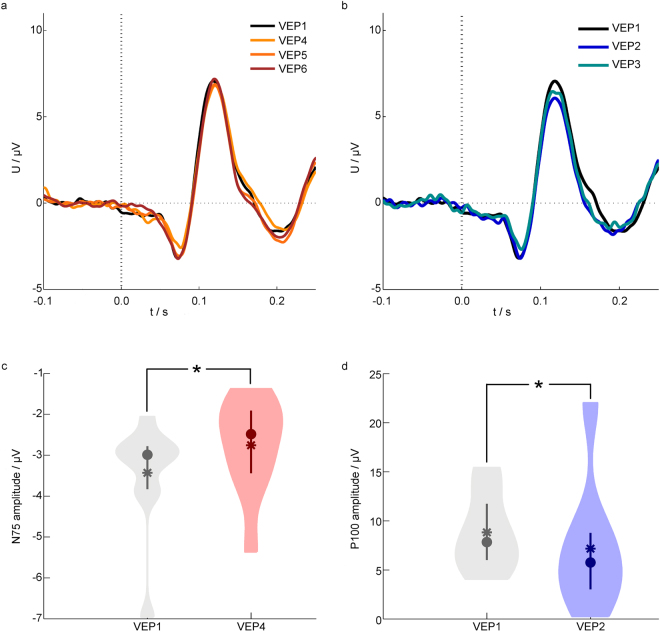
Figure 3.
Grand average and statistical characteristics of the VEPs. (a) Grand average VEPs of all volunteers before and after tDCS in channel PO2. (b) Grand average VEPs of all volunteers before and during tDCS in channel PO2. (c–d) Violin plots of the amplitudes of the N75 (c) and P100 (d) components. Statistical characteristics are depicted by the mean (squares), median (circles), interquartile range (vertical lines) and the distribution of the data smoothed based on a normal kernel density estimation (coloured areas). Statistically significant differences are indicated by *. | tDCS – transcranial direct current stimulation; VEP – visual evoked potential.

