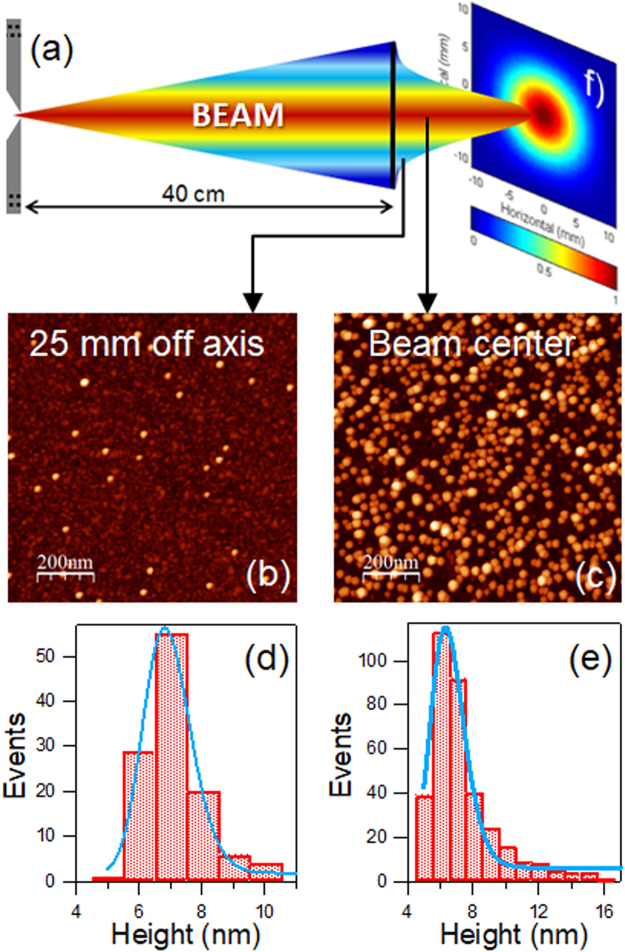
Figure 4.
(a) Illustration of the beam divergence at the exit of the MICS with the Gaussian profile measured with QCM-1. AFM images of nanoparticles collected (b) at 25 mm off axis and (c) at the beam center. Log-normal distribution of the height on the nanoparticles collected (d) at 25 mm off axis, and (e) at the beam center. (f) Beam shape derived from the optical absorption measured in the mid-IR region of nanoparticles deposited on a glass slide at 740 mm from the MICS exit.

