Figure 2.
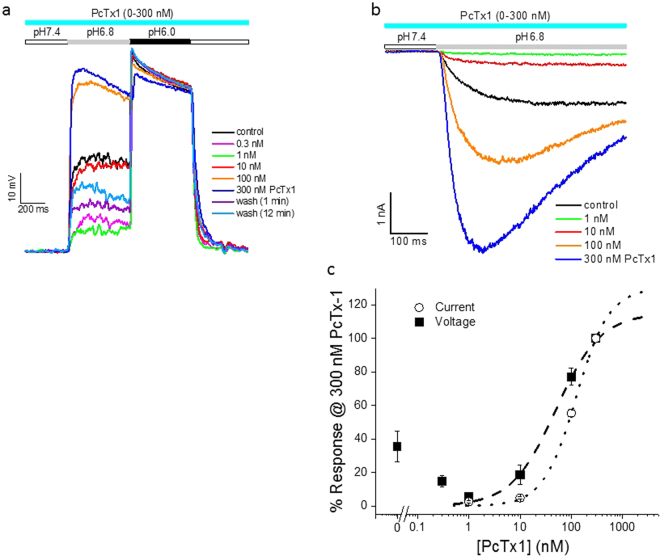
Potentiation by PcTx1 of ASIC1a/2a stably expressed in CHO cells. (a) Traces of pH6.8- and pH6.0-induced membrane depolarization from a single cell in the absence and presence of 0.3–300 nM PcTx1. PcTx1 was continuously applied in the order of increasing concentration till reaching steady state at each concentration. Note that the decrease in pH6.8-induced depolarization in the presence of 0.3 nM and 1 nM PcTx1 was reversed by 10–300 nM PcTx1. (b) Current traces from a single cell showing inhibition by 1 nM PcTx1 and potentiation by 10–300 nM PcTx1 of pH6.8-induced current responses. (c) Average % change in the amplitude of pH6.8-induced depolarization (solid squares; n = 7) and peak current (open circles; n = 6) as a function of PcTx1 concentration. Data were normalized to the value at 300 nM PcTx1 for each cell before averaging. Only data between 1 nM and 300 nM PcTx1 were used for curve fitting (dashed and dotted lines). IC50 values from the fits are 56.1 nM (depolarization) and 123.9 nM (current), respectively. The conditioning pH was 7.4 for all the experiments shown in Fig. 2.

