Figure 1.

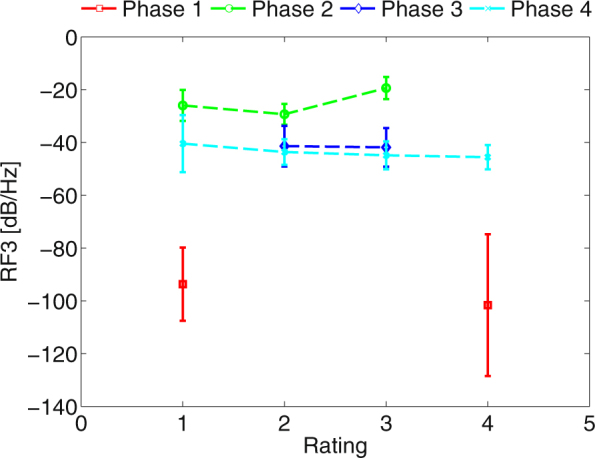
Standard deviation and mean of RF3 against pilots perceived stress rating (1–most perceived stress, 4–least perceived stress) across all flight phases (1–before engine failure, 2–engine failure, 3–glide, 4–approach and landing).

Standard deviation and mean of RF3 against pilots perceived stress rating (1–most perceived stress, 4–least perceived stress) across all flight phases (1–before engine failure, 2–engine failure, 3–glide, 4–approach and landing).