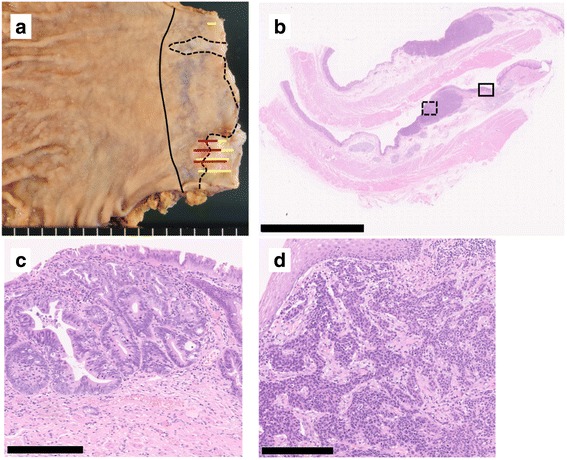
Fig. 3.

Histological findings of MANEC. Macroscopically, a type 0-IIa + IIc lesion measuring 25 × 10 mm was detected in the esophagogastric junction. The black solid line indicates the esophagogastric junction, the black dotted line the squamocolumnar junction, the yellow line the adenocarcinoma component, and the red line the NEC component (a). A loupe image of the lesion is shown (b, scale bar 10 nm). The solid rectangle indicates well differentiated adenocarcinoma (c scale bar 250 μm), and the dotted rectangle indicates an area of proliferation of round-shaped carcinoma cells with hyperchromatic nuclei and scant cytoplasm in a nested pattern, indicative of small cell NEC (d scale bar 250 μm)
