
Fig. 4.
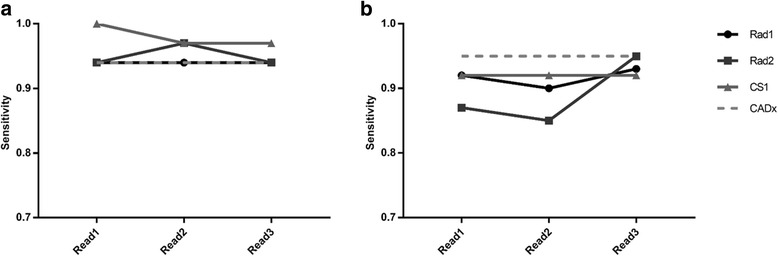
Sensitivity figures for the three image reads. Sensitivity figures for the three image reads, for local data (a) and PPMI data (b). Standalone CADx performance is also shown, for comparison
Official websites use .gov
A
.gov website belongs to an official
government organization in the United States.
Secure .gov websites use HTTPS
A lock (
) or https:// means you've safely
connected to the .gov website. Share sensitive
information only on official, secure websites.
Sensitivity figures for the three image reads. Sensitivity figures for the three image reads, for local data (a) and PPMI data (b). Standalone CADx performance is also shown, for comparison