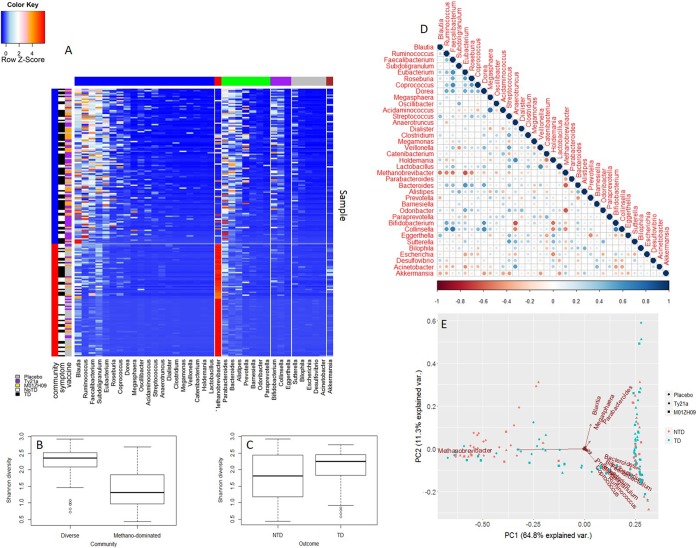
FIG 2 .
Metatranscriptome profiling of longitudinal samples. (A) Longitudinal metatranscriptome data were used as input for an in-house k-means clustering pipeline. Vertical side bars (red and blue) represent two community types that were identified: methanogen-dominated and diverse Firmicutes, respectively. Horizontal side bars are color coded as follows: blue, Firmicutes; red, Euryarchaeota; green, Bacteroidetes; purple, Actinobacteria; gray, Proteobacteria; brown, Verrucomicrobia. (B) Shannon diversity values were calculated for the two communities and were significantly different (P values ≤ 0.01). (C) Shannon diversity values calculated between the two clinical outcomes (no TD [NTD] or TD) were not significantly different (P values = 0.15). (D) Relationship between genera was assessed by Spearman’s rank correlation coefficient using average genus abundances at baselines. Size and color of circles represent the correlation shown in the color bar. (E) Principal-component analysis was applied to visualize dissimilarities among samples.

