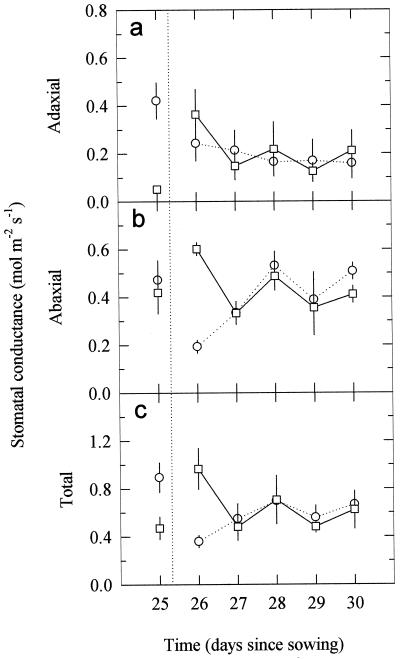
Figure 3.
Changes in the adaxial (a), abaxial (b), and total (adaxial plus abaxial) (c) gs over 5 d for previously unexposed 21-d-old pea plants moved to 0.63 W m−2 of UV-B (○) or for previously exposed plants moved to no UV-B (□). The vertical dotted line indicates the time of transfer. Data are the means ± se of six replicates (se values are shown when larger than the symbols).

