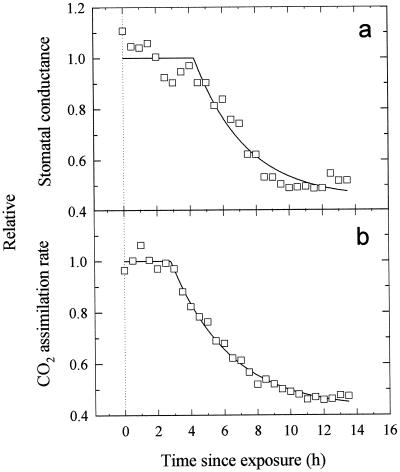
Figure 5.
Exponential decline time courses of total gs (a) and A (b) in illuminated mature pea leaves after exposure at t = 0 to 0.63 W m−2 of UV-B irradiation. Lines shown were fitted by nonlinear regression using the model y = yf + ae−b(t−to), where yf is the estimated final value, b is (time constant)−1, to is the lag time, and a the overall change in y. Symbols indicate means of three leaves replotted from Figure 4.

