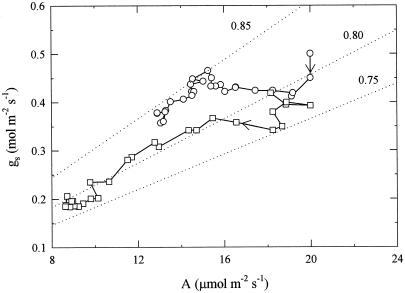
Figure 6.
Relationship between total gs and A in illuminated mature pea leaves throughout 14 h of no UV-B (○) and 0.63 W m−2 of UV-B (□) treatments. Points were joined in the time course in the order indicated by the arrows. Dotted lines indicate the relationship between gs and A if the ratio ci/ca was constant at the value indicated. Data are the means of three replicates, and are replotted from Figure 4.

