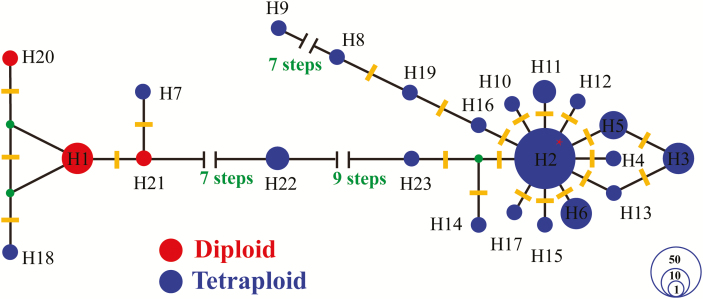
Figure 4.
Median-joining network of ITS2 sequences in British Euphrasia. Numbers correspond to the ITS2 copies in Table 1. Alleles are coloured by ploidy, with diploids in red and tetraploids in blue. Hypothetical (unsampled) alleles are represented by filled green circles. H2 is the only allele shared across ploidy groups, found in 66 tetraploids and 1 diploid (indicate by the red asterisk). Yellow bar represents variation steps. The circle size represents the approximate numbers of individuals, and the scale is provided in the lower right corner.

