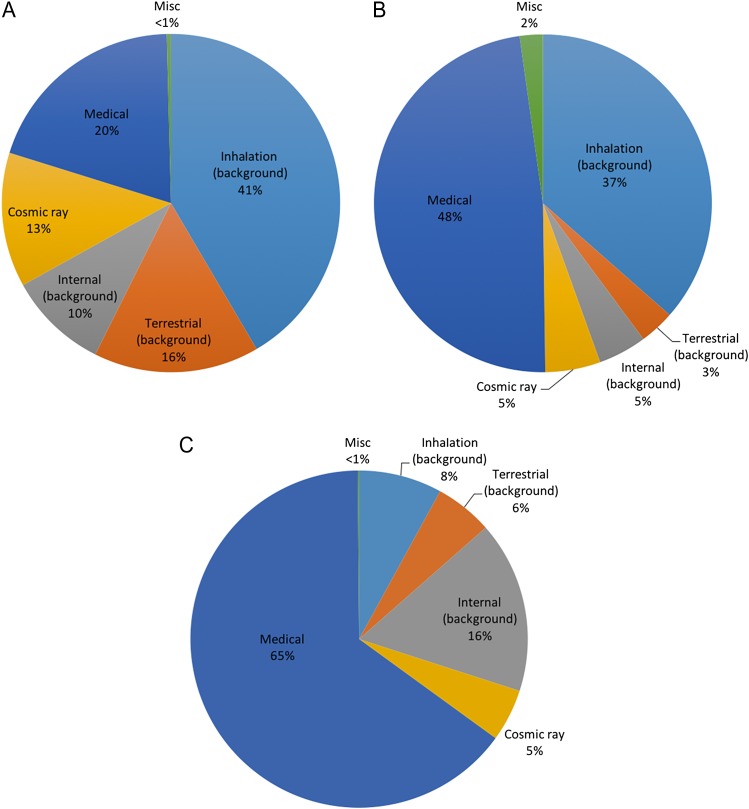
Fig. 1.
A comparison of the sources of public radiation worldwide (UNSCEAR 2008) [7], in the USA (2009) [8] and Japan (2011) [9]. (A) UNSCEAR in 2008. (B) USA in 2009. (C) Japan in 2011. All of the sources that account for <1% of the total radiation burden (i.e. occupational radiation, nuclear power, and nuclear weapons) are labeled ‘Misc’. The frequency of medical radiation in the USA and Japan was higher than that in UNSCEAR.

