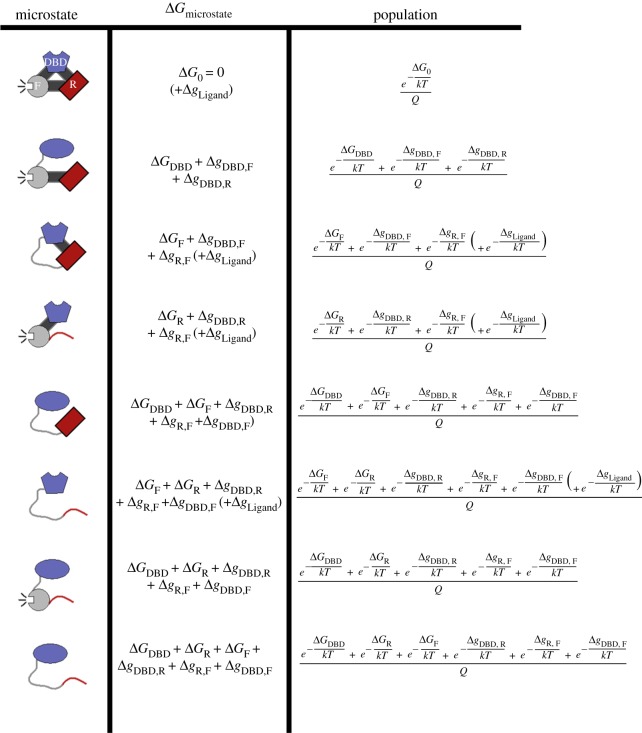
Figure 3.
Diagram of microstates and populations for the ensemble of a three-domain allosteric model of GR. The inactive states are schematically depicted as curved lines and the active states as filled shapes. The three domains, modelled after the GR A isoform, are labelled DBD (DNA-binding domain, blue), R (Regulatory domain, red) and F (functional domain, grey). The fully active protein (first row) is used as a reference state for the values of ΔG. To get the probability of any microstate, one must first calculate the statistical weight of all the microstates. The statistical weight of any given state is the natural exponential of an ΔG describing that state (equation (2.1)); these are the numerators of the third column. The probabilities are then the statistical weight of the desired state, divided by the sum, Q, of all statistical weights (equation (2.2)). Values of Δg set in lower case represent interaction energies between domains. The GR A isoform may access eight microstates in the ensemble, as depicted here. By contrast, the truncated C3 isoform (composed only of the F-domain and the DBD) can be represented by only four microstates (i.e. those containing R-domain would be missing, not shown). In the EAM, the experimental observable of transcriptional activity is represented by the probability of states whose F-domain is folded (i.e. rows 1, 2, 4, 7 of this figure). The experimental observable of DNA binding affinity is represented by the probability of states whose DBD exhibits the high-affinity DBD (folded) conformation (i.e. rows 1, 3, 4, 6). In the presence of DNA (figure 4), these particular states may access an additional energy level due to DNA binding, this possibility is accounted for by the parenthetical (+ΔgLigand) term.

