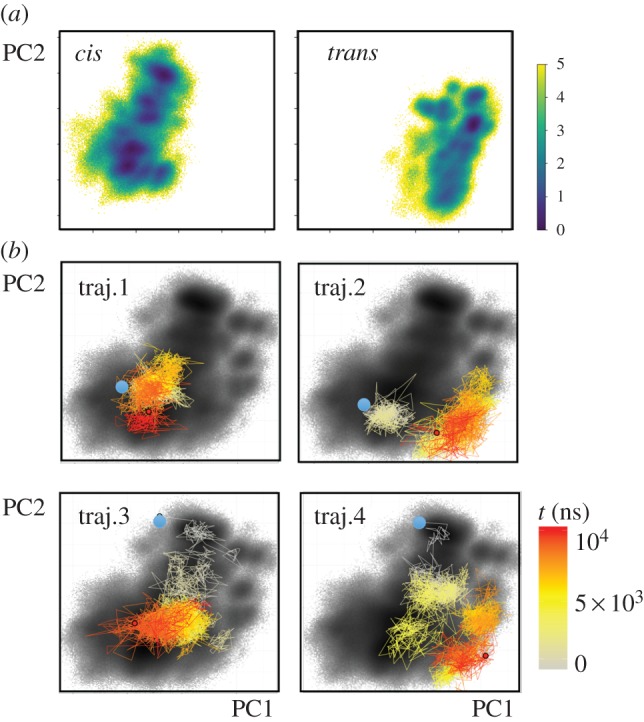
Figure 4.

Two-dimensional representation of the free-energy landscape ΔG (in units of kBT), plotted as a function of the first two principal components PC1 and PC2. (a) Energy landscapes associated with the cis and trans equilibrium states of PDZ2. (b) Free-energy landscape associated with the non-equilibrium allosteric transition, drawn as black background. The coloured lines indicate the time evolution of selected single non-equilibrium trajectories. Adapted with permission from Buchenberg et al. [32].
