Figure 5.
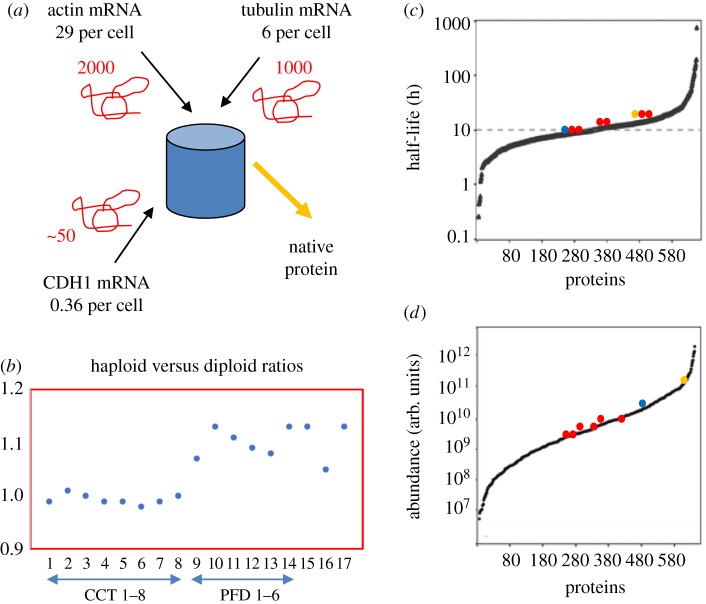
Yeast CCT capacity. Number estimates for the components of this yeast model are from the following sources. (a) Calculated mRNA copy numbers per cell based upon 15 000 transcripts per cell growing at 30°C - ACT1: 28.97, CDH1: 0.36, TUB2: 5.94, TCP1: 1.81, CCT2: 1.56, CCT3: 1.62, CCT4: 2.16, CCT5: 2.24, CCT6: 2.61, CCT7: 2.23, CCT8: 1.7, CDH1: 0.36 [30]. Red squiggles represent estimate of steady state number of nascent chains bound to CCT. (b) Haploid versus diploid protein ratios for CCT subunits (1–8), prefoldin subunits (9–14), ACT1 (15), TUB2 (16), PLP2 (17) taken from de Godoy et al. [31]. (c,d) Half-live distributions (hours) and steady-state abundance distributions (arbitrary units) of 641 proteins [53] are plotted according to increasing value on the x-axis. Half-lives and adundances of CCT subunits (red dots), ACT1 (yellow dot) and TUB2 (blue dot) are highlighted on each distribution. (Online version in colour.)

