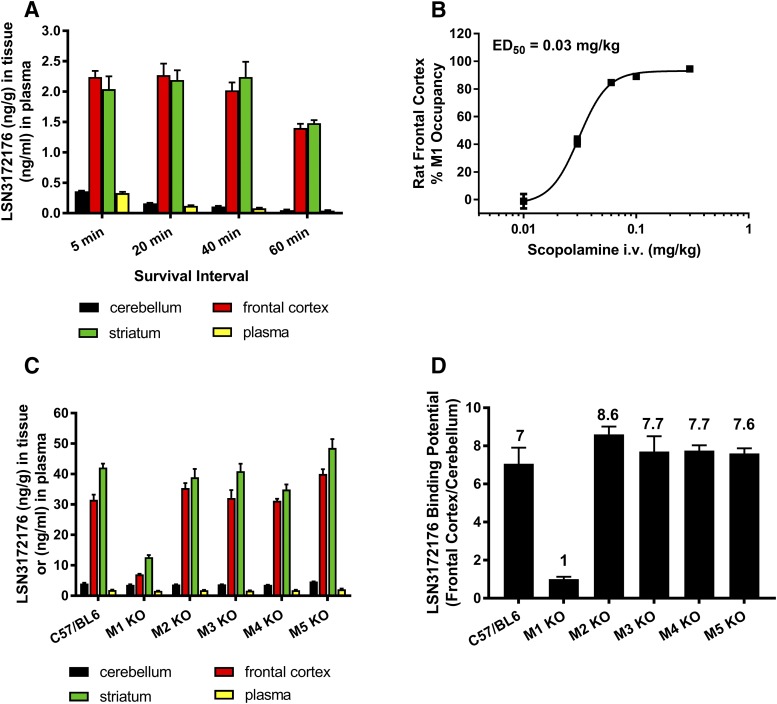
Fig. 9.
In vivo distribution and occupancy of LSN3172176 in the rat and mouse. (A) Tissue distribution and plasma levels of LSN3172176 in the rat over time. Rats were dosed with 0.3 μg/kg (i.v.) of LSN 3172176 and sacrificed at the indicated intervals. The amount of LSN3172176 in each tissue was quantified by LC/MS as described in Materials and Methods. (B) Scopolamine block of LSN3172176 receptor occupancy in rat frontal cortex. Rats were predosed with 0.01–0.3 mg/kg scopolamine (i.v.) prior to administration of 0.3 μg/kg LSN3172176. After 20 minutes animals were sacrificed and the amount of LSN3172176 in each tissue quantified by LC/MS as described in the Materials and Methods (C) Tissue distribution and plasma levels of LSN3172176 in wild-type and M1–M5 mAChR KO Mice. Mice were dosed with 10 μg/kg LSN3172176. After 20 minutes animals were sacrificed and the amount of LSN3172176 in each tissue quantified by LC/MS as described in the Materials and Methods. (D) Binding potential comparisons for LSN3172176 in wild-type vs. M1–M5 mAChR KO Mice. The in vivo binding potential was calculated by dividing the amount of LSN3172176 in the frontal cortex by the amount determined in the cerebellum by LC/MS. Bars/points represent mean ± S.E.M. from n = 3–5 male mice or rats per treatment group.

