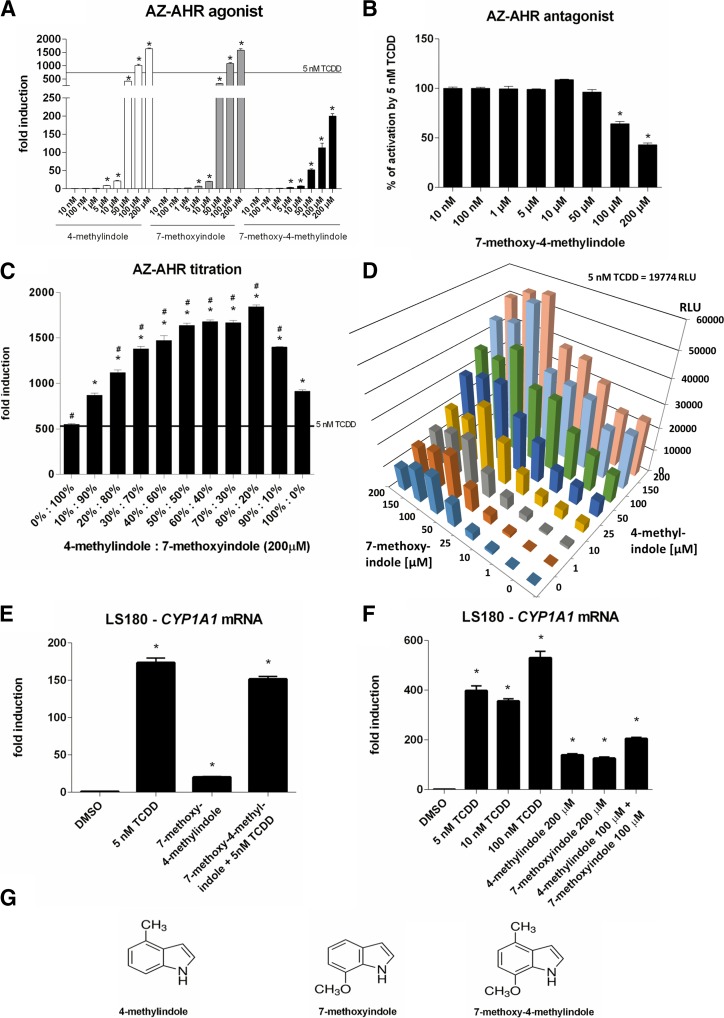
Fig. 5.
Effects of lead indoles (4-Me, 7-MeO) and coupled 7-MeO-4-Me-indole on AhR-CYP1A1 pathway. (A and B) Reporter gene assay: dose response. AZ-AHR cells were incubated for 24 hours with vehicle (DMSO; 0.1% v/v) and tested compounds (10 nM–200 μM) in the absence (A) or presence (B) of TCDD (5 nM). Experiments were carried out in two consecutive passages of AZ-AHR cells and the representative experiment is shown. Data are mean ± S.D. from measurements performed in quadruplicate. Inserted horizontal line refers to activation attained by 5 nM TCDD. *P < 0.05 indicates a value different from control cells. (C) Reporter gene assay: binary titration. AZ-AHR cells were incubated for 24 hours with mixtures of 4-Me-indole and 7-MeO-indole in final concentrations of 200 μM. Different ratios of 4-Me:7-MeO were applied, ranging from 0%:100% to 100%:0%, applying a step of 10%. Experiments were carried out in two consecutive passages of AZ-AHR cells and the representative experiment is shown. Data are mean ± S.D. from measurements performed in quadruplicate. Inserted horizontal line refers to an activation attained by 5 nM TCDD. *P < 0.05 indicates a value different from cells incubated with 7-MeO-indole; #P < 0.05 indicates a value different from cells incubated with 4-Me-indole. (D) Reporter gene assay: large-scale three-dimensional titration. AZ-AHR cells were incubated for 24 hours with mixtures of 4-Me-indole and 7-MeO-indole, each compound in concentrations of 1, 10, 25, 50, 100, 150, and 200 μM. In total, 64 different combinations were tested, with the highest total concentration of indoles being 400 μM. Experiments were carried out in two consecutive passages of AZ-AHR cells and the representative experiment is shown. Measurements were performed in quadruplicate. Inserted text refers to an activation attained by 5 nM TCDD. (E and F) Reverse transcription (RT)-PCR: CYP1A1 mRNA. LS180 cells were incubated for 24 hours with vehicle (DMSO; 0.1% v/v), TCDD (5, 10, and 100 nM), 4-Me-indole, 7-MeO-indole, and 7-MeO-4-Me-indole or the combinations. Incubations were carried out in two consecutive passages of LS180 cells and the representative experiment is shown. The level of CYP1A1 mRNA was determined by RT-PCR and the data were normalized to the GAPDH mRNA level. Data are mean ± S.D. from experiments performed in triplicate. *P < 0.05 indicates a value different from control cells. (G) Chemical structures of tested compounds.

