Fig. 3.
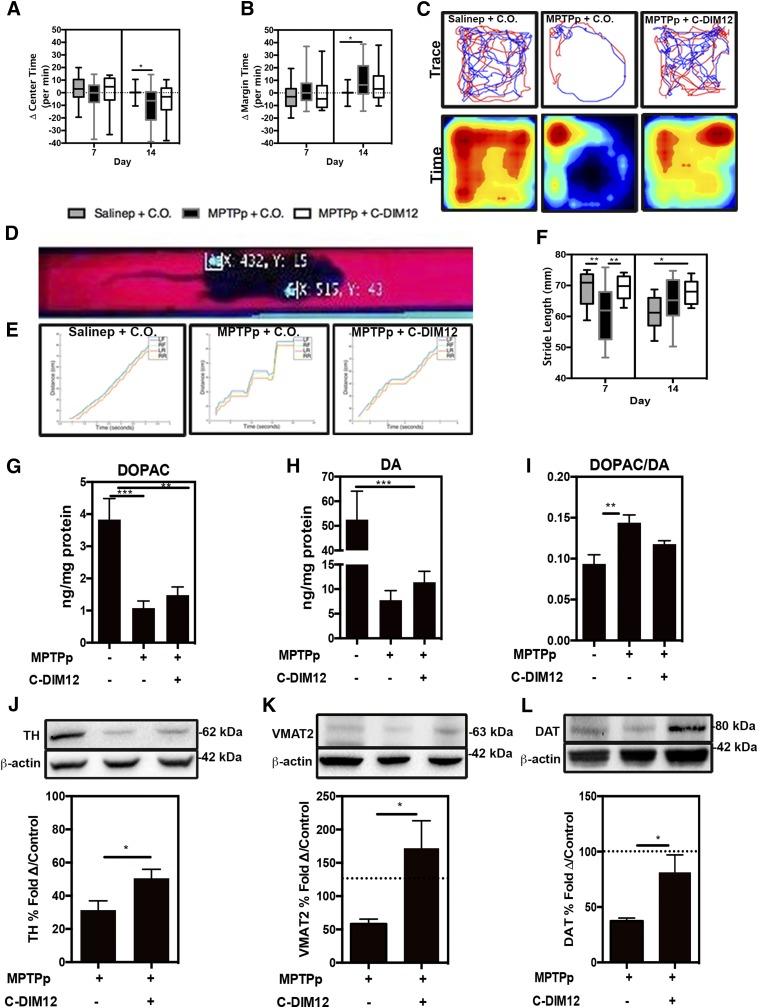
Neurobehavioral deficits associated with PD are ameliorated and DA proteins are preserved with C-DIM12 treatment. OFT was conducted on mice at days 0, 7, and 14 during the study. The change from day 0 per minute of OFT center time (A) and margin time (B) was quantitated at days 7 and 14. (C) Trace and pseudo-colored time plots represent OFT mouse movement at day 14. (D) Representative image shows a real-time video gait analysis system used to detect paw coordinates for quantitative measurement. (E) Gait images depict distance vs. time graphs in animals in each group at day 7. (F) Graph displays stride length measured at days 7 and 14. HPLC was used for the measurement of DA metabolite, DOPAC (G), DA (H), and the DOPAC/DA ratio (I) from each experimental group. Western blot analysis of striatal protein depicts levels of TH (J), VMAT2 (K), and DAT (L) (*P < 0.05; N = 10-12 animals/group for behavior, N = 6–8 animals/group for Western Blot).

