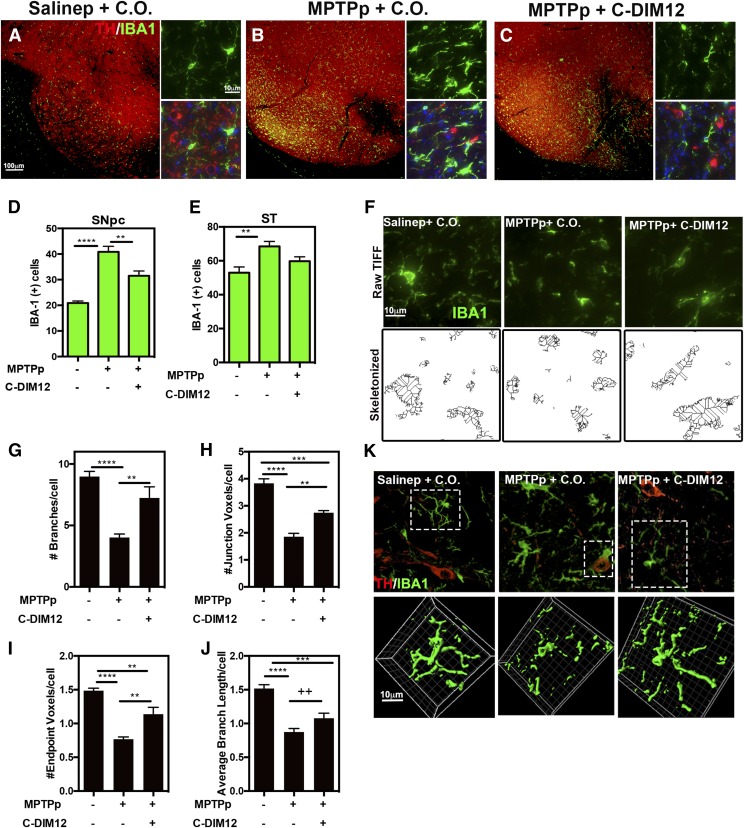
Fig. 4.
C-DIM12 suppresses microglia proliferation and maintains a ramified morphologic phenotype; 10× and 100× objective representative images of TH (red) and microglia marker IBA-1 (green) in the SN are depicted for animals treated with Salinep + C.O. (A), MPTPp + C.O. (B), and MPTPp + C-DIM12 (C). Gliosis counts of the SNpc (D) and ST (E) tissue were conducted for IBA+ cells. To visualize microglia morphology changes of IBA+ cells in the SNpc (F), multiple 40× objective images were also transformed in ImageJ for skeletonization and quantitation of microglia branches (G), junctions (H), endpoints (I), and average branch lengths (J) (++P < 0.1; *P < 0.05; **P < 0.01; ***P < 0.001; ****P < 0.0001; N = 12 animals/group for counts, n = 6 animals/group for skeletonization). (K) The 64× objective, 3D images of microglia in SNpc were surfaced rendered on the channel for IBA-1 in each experimental group (boxed cells from top images with IBA-1/TH were selected; see Supplemental Videos 1–4).

