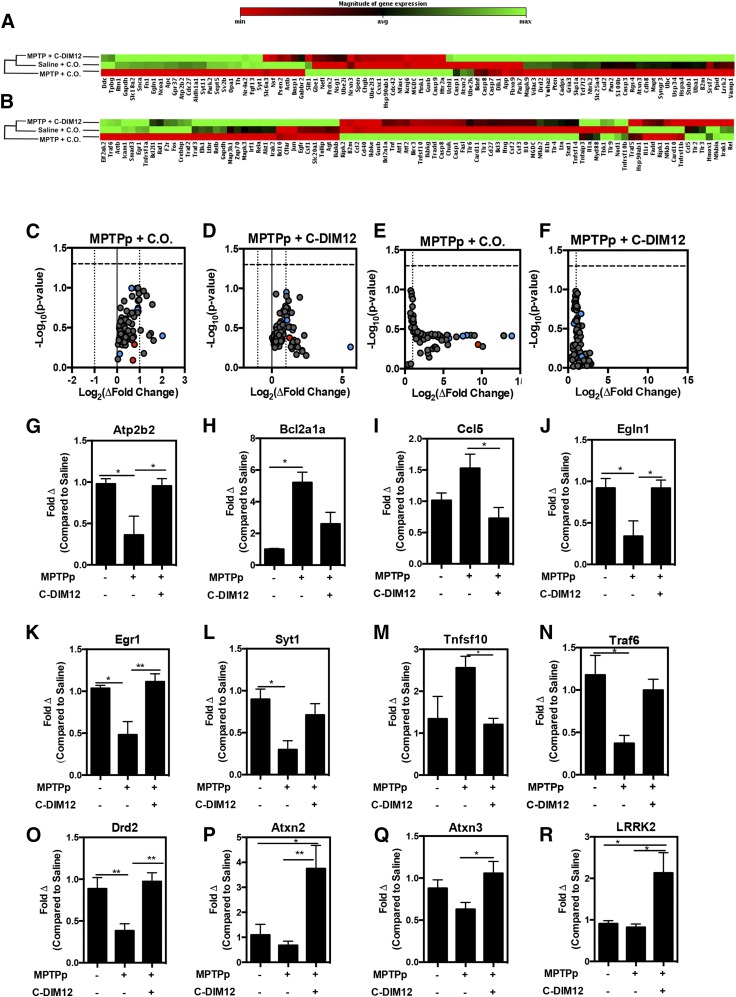
Fig. 6.
PD-associated/NF-κB–regulated gene expression is preserved in MPTPp + C-DIM12–treated mice. (A) Ontology dendrogram heat maps of 84 PD-associated genes from SNpc RNA depicts a cluster grouping with MPTP + C-DIM12–treated and saline-treated groups. Notice that NR4A2 (Nurr1) is lower in the MPTP + C.O.–treated group. (B) Heat map of 84 NF-κB–regulated genes analyzed from SNpc RNA. Map depicts a cluster grouping to saline control levels in MPTP + C-DIM12–treated tissue (red = increase; green = decrease). Volcano plots from PD (C and D) and NF-κB (E and F) arrays show fold changes for MPTP + C.O. and MPTPp + C-DIM12 groups compared with saline controls (red = minimum expression; green = maximum expression). Quantitative expression data for Atp2b2 (G) Bcl2a1a (H), Ccl5 (I), Egln1 (J), Egr1 (K), Syt1 (L) Tnfsf10 (M), and Traf6 (N) depict significant gene fold changes with experimental groups (*P < 0.05; **P < 0.01; N = 4 to 5 mice/group). Additional neuronal genes DrD2 (O), Atxn2 (P), Atxn3 (Q), and LRRK2 (R) were also examined for C-DIM12–induced fold changes (*P < 0.05; **P < 0.01; N = 9–10 mice/group).

