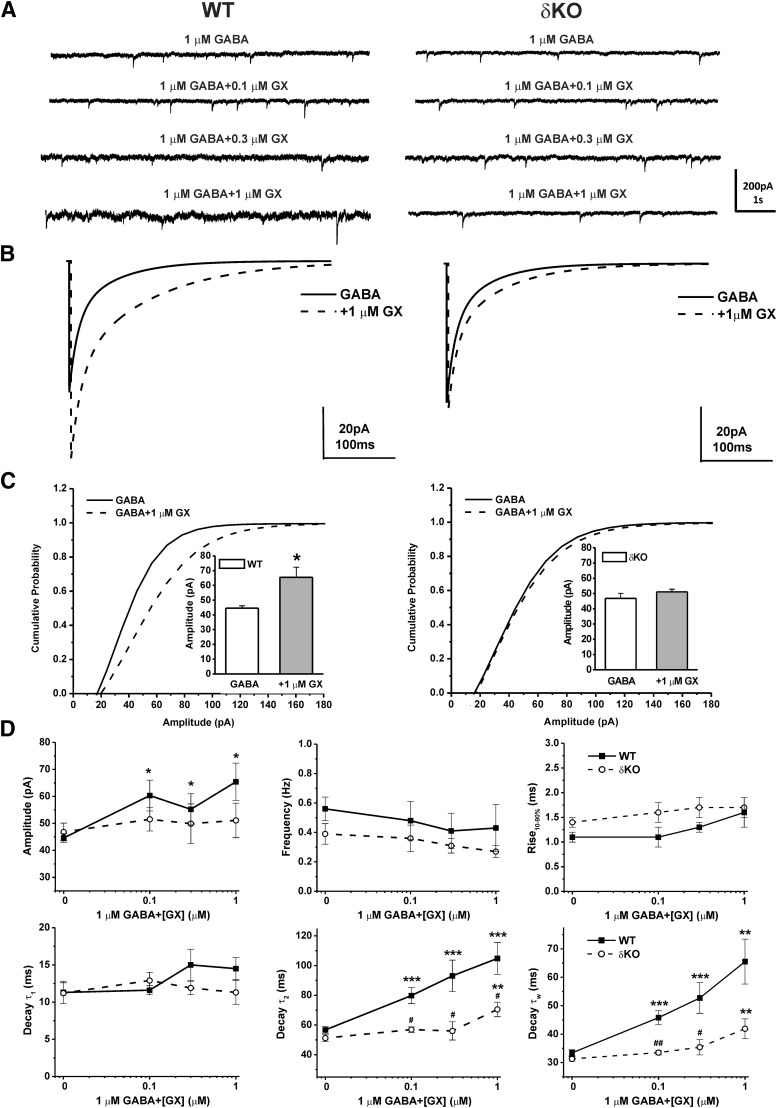
Fig. 8.
GX concentration-dependent potentiation of mIPSCs was attenuated in DGGCs from δΚΟ mice. (A) Representative traces of phasic currents by patch-clamp recording from WT or δΚΟ DGGCs in the presence of 1 μM GABA, 1 μM GABA + 0.1 μM GX, 1 μM GABA + 0.3 μM GX, and 1 μM GABA + 1 μM GX. (B) Averaged mIPSC events recorded from WT [(B), left] or δΚΟ [(B), right] DGGCs in the presence of 1 μM GABA (solid line) or 1 μM GABA coapplied with 1 μM GX (dashed line). Cumulative probability curves for WT (C, left) or δΚΟ [(C), right] mIPSC amplitude, plotted from all events. The Kolmogorov-Smirnov test was used to compare mIPSCs before and after application of GX in DGGCs. [(C), insets] Mean peak amplitude of mIPSCs in WT (left) or δΚΟ (right) DGGCs in the presence of 1 μM GABA or 1 μM GABA coapplied with 1 μM GX. *P < 0.05 vs. GABA alone (n = 14–19 cells per drug concentration). (D) Summary graphs of concentration-response relationship for amplitude, frequency, rise time (10%–90%), decay τ1, decay τ2, and mean weighted decay time (τw) of GX modulation in DGGCs from WT or δΚΟ mice. Each point represents mean ± S.E.M. *P < 0.05; **P < 0.01; ***P < 0.001 vs. GABA; #p < 0.05; ##p < 0.01 vs. WT (n = 7-10 cells).

