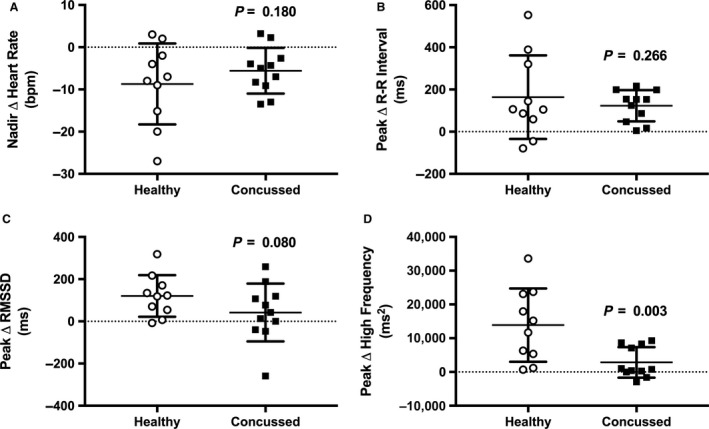
Figure 2.

The individual responses and means ± SD for the nadir heart rate (A), and peak R‐R interval (B), root mean square of successive differences (C), and high‐frequency power (D) during face cooling independent of time. Data were analyzed using unpaired t‐tests.
