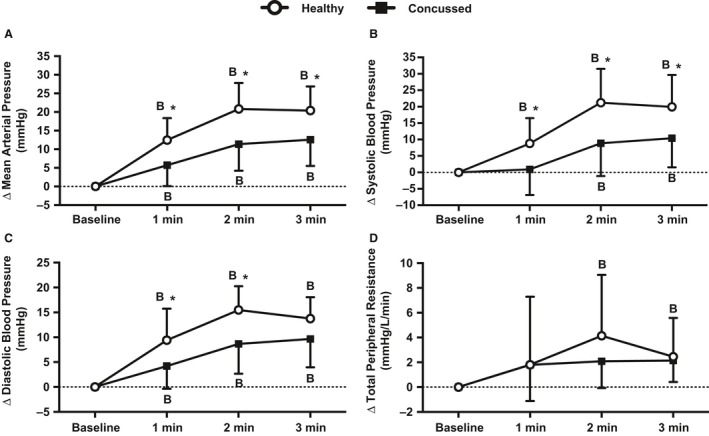
Figure 4.

Changes in mean arterial pressure (A), systolic blood pressure (B), diastolic blood pressure (C), and total peripheral resistance (D) from baseline during 3 min of face cooling in healthy and symptomatic concussed athletes. Data were analyzed using repeated measures ANOVA followed by the Holm‐Sidak procedure for multiple comparisons if a significant interaction or main effect was found. Data are presented as mean ± SD. B = different from baseline (P ≤ 0.032), *different from concussed athletes (P ≤ 0.049).
