Figure 5.

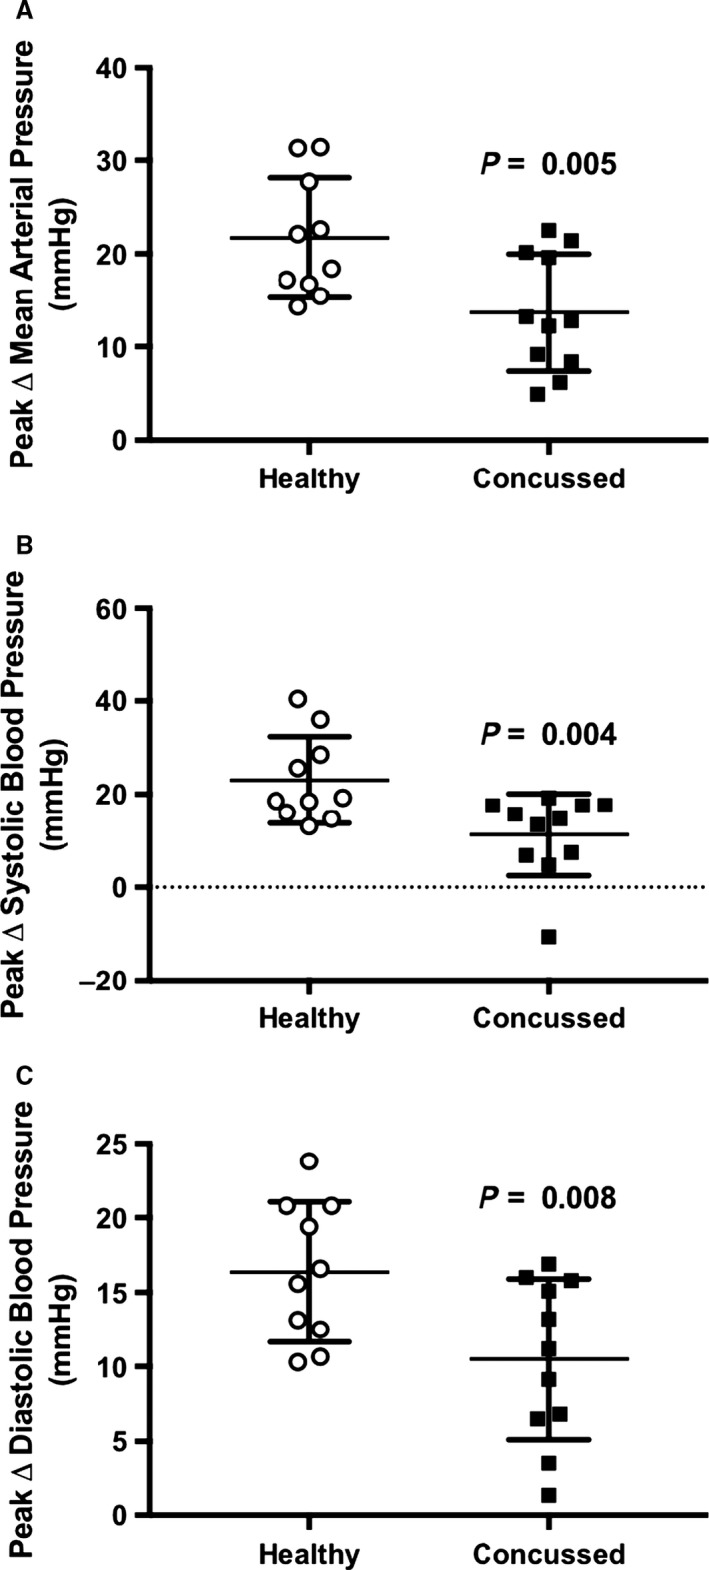
The individual responses and means ± SD for the peak increases in mean arterial pressure (A), systolic blood pressure (B), and diastolic blood pressure (C) during face cooling independent of time. Data were analyzed using unpaired t‐tests.

The individual responses and means ± SD for the peak increases in mean arterial pressure (A), systolic blood pressure (B), and diastolic blood pressure (C) during face cooling independent of time. Data were analyzed using unpaired t‐tests.