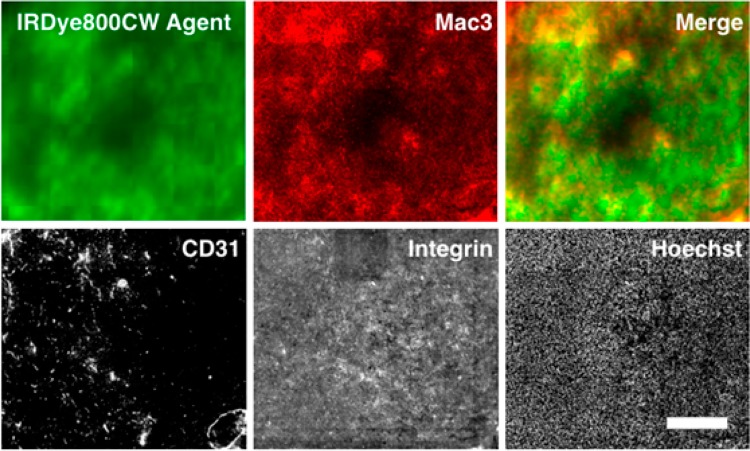
Figure 4.
Macroscopic images of a tumor histology slide taken on an Odyssey CLx (agent) and Olympus FV1200 confocal microscope (other channels). The orally delivered agent shows a diffuse pattern in tumors compared to the negative control (Figure S6). The intensity appears to be slightly higher in regions with higher macrophage density versus tumor cells or blood vessels (CD31). The slides were labeled with the AF680 agent ex vivo (integrin) and stained with Hoechst 33342 to show the presence of cells and integrin throughout the tissue. Scale bar = 500 μm.

