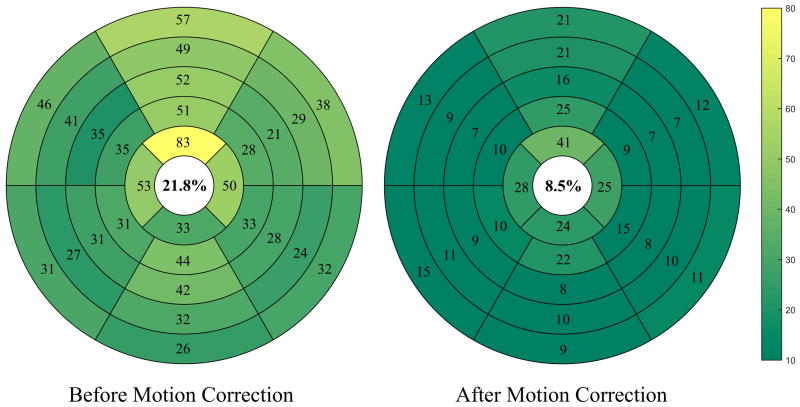
Figure 8.
Bullseye representation of the number of corrupted segments of five short axial slices before and after motion correction. The myocardium at basal and mid-cavity slices is divided into six standard segments, while the apical slice is divided into four segments. We see a significant decrease in the number of corrupted T1 myocardial segments (represented by dark color) after motion correction than before motion correction (represented by bright color).

