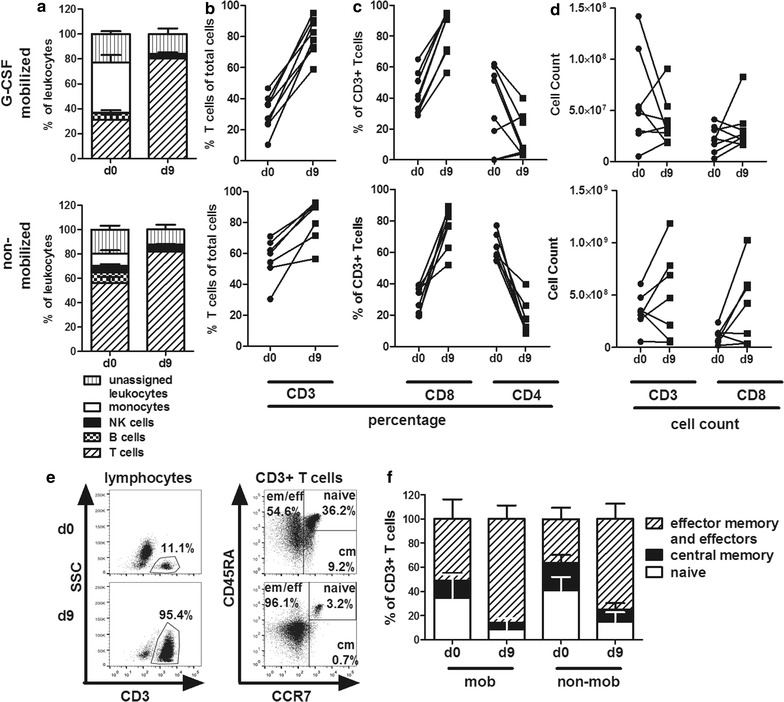
Fig. 3.

Comparison of cell composition on day 0 before peptide stimulation and day 9 at the end of expansion. a Relative composition of leukocytes at day 0 (d0) and day 9 (d9) after peptide stimulation from G-CSF mobilized (upper panel, n = 8) and non-mobilized donors (lower panel, n = 8). b Proportion of CD3+ T cells in total cells. c Proportion of CD8+ and CD4+ T cells within the CD3+ population. d Absolute counts of CD3+ T cells and of CD8+ CD3+ T cells. e Expression of T-cell differentiation markers on day 0 and day 9 of culture from one exemplary donor; cm, central memory; eff/em, effector and effector memory. f Cumulative analysis of T-cell differentiation in cultures from 7 donors of each type (G-CSF mobilized and non-mobilized donors)
