Fig. 4.

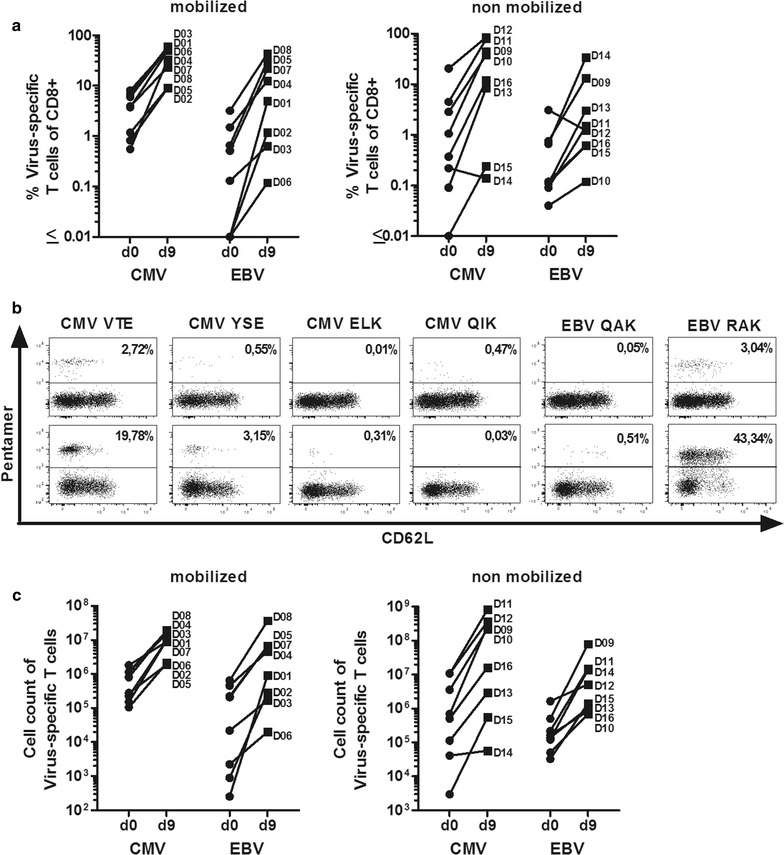
Analysis of CMV- and EBV-specific T cells before and after peptide stimulation. a Proportion of CMV-specific (CMV epitopes, left row) and of EBV-specific T cells (EBV epitopes, right row) on day 9 compared to day 0 as determined by HLA/peptide multimer staining (left panel: mobilized donors, n = 8; right panel: non-mobilized donors, n = 8). The cumulative proportions of T cells obtained from stainings with each applicable (HLA-compatible) multimer is shown for each donor. b Flow cytometric analysis for HLA/peptide multimer binding cells (% of CD8+ T cells) of one representative donor. c Comparision of absolute cell count of CMV-specific (CMV epitopes, left row) and EBV-specific T cells (EBV epitopes, right row) on day 9 compared to day 0 as determined by HLA/peptide multimer staining (left panel: mobilized donors, n = 8; right panel: non-mobilized donors, n = 8). a, c D01 to D12 designate the donors, as listed in Table 2
