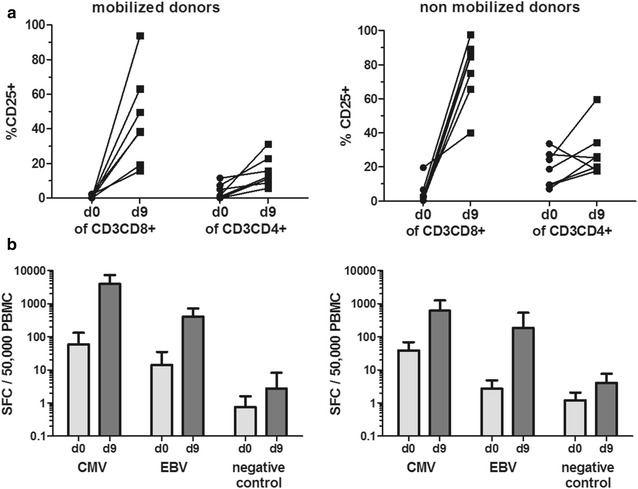
Fig. 5.

Activation and cytokine production of CMV- and EBV-specific T cells. a CD25 expression as activation marker is shown on day 0 and day 9 for CD4+ and CD8+ T cells of G-CSF mobilized (left panel) and non-mobilized (right panel) donors, analyzed by flow cytometry. b Secretion of the effector cytokine IFN-γ was analyzed by ELISpot assay after restimulation with CMV or EBV peptide pool. Shown is the number of spot-forming cells (SFC)/50,000 PBMC as mean ± SD from 5 independent donors. As a negative control, the irrelevant gp100 peptide ITDQVPFSV was used
