
Fig. 3.
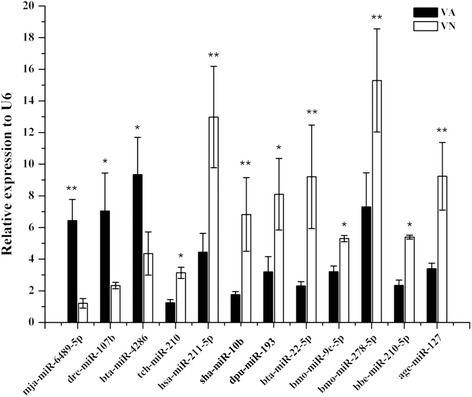
Validation of differentially expressed miRNAs between VN and VA treated group by qPCR. Real-time qPCR was used to analyze the relative expression of 12 miRNAs and normalized to U6 snoRNA. Data presented is average of three independent experiments. The error bar represents the S.D. of the mean (n = 3). The statistical significance was calculated using Student’s t-test with p < 0.05 considered statistically significant compared with NS control