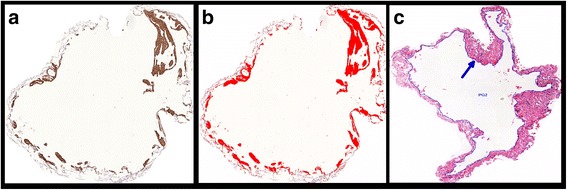
Fig. 3.

Representative image analysis. Panel a shows an SMA-stained extracted LAM lesion. Panel b shows the positively stained area (red) at image analysis. Panel c shows the internal perimeter (arrow pointing to the blue perimeter line) of the cystic component of a LAM lesion (H&E staining). Magnification: 40X
