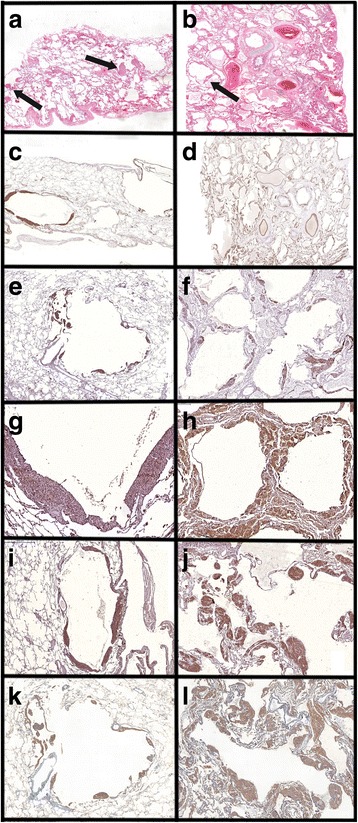
Fig. 5.

Representative histological images of H&E staining and immunohistochemistry for protein expression (stained in brown) in each group. All immunohistological parameters showed significantly higher values in the more severe group. a, c, e, g, i, and k: the less severe group; b, d, f, h, j, and l: the more severe group. A and B: H&E staining showing the distribution of cysts and LAM-cells nodules (arrows) in each group (magnification: 5×). c and d: SMA expression in LAM-cells (magnification: C, 7× and D, 7×). e and f: HMB-45 expression in LAM-cells (magnification: E, 20× and F, 40×). g and h: VEGF-D expression in LAM-cells (magnification: G, 100× and H, 100×). i and j: MMP-9 expression in LAM-cells (magnification: I, 25× and J, 25×). k and l: mTOR expression in LAM-cells (magnification: K, 35× and L, 35×)
