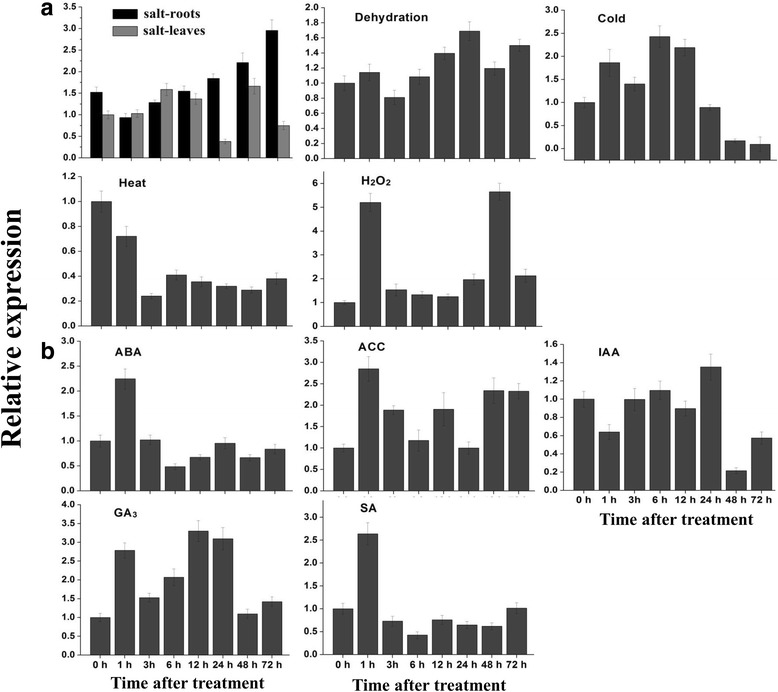
Fig. 2.

Expression profiles of SlbZIP1 gene under various abiotic stress (a) and hormone (b) treatments. Gene expression was detected by qRT-PCR using total RNA from leaves or roots of WT plants. The relative expression levels were normalized to 1 in control plants (0 h). Bars represent the mean of three biological replicates ± SE
